


Stock Market Sell In May and Go Away
Stock-Markets / Stock Markets 2019 May 28, 2019 - 08:49 PM GMTBy: Plunger

 In this report we will look at the state of the stock market and update the condition of a potential bottom in the gold space.
Sell in May and Go Away
You have all heard this Wall Street ditty before and it is now upon us at this moment. Despite this old market rule being an established truism, few actually use it to make money. Instead the daily market action draws investors back into the market typically in search of that illusory “Summer Rally”. Instead they typically find themselves in the stock market’s “Summer Doldrums”. I can’t quote the exact statistics, however if one was to simply sell in May and stay out of the market until the typical October weakness, then go back in whole hog his returns would greatly outpace the returns of the market itself. So the sell in May phenomenon is real. Let’s try to use it to our advantage.
Time to Start Sharpening our Knives
This means it’s time to begin shorting the market… selectively that is. I have shown in the past that shorting is most profitable if one holds off until the second half of a bear market. That’s because the market starts providing decent follow through on the downside. We are not there yet since it’s still early on in phase I of the bear market, however selective shorts can be taken when a set-up presents itself. Later on in this report I will present a few short sale set-ups.
Bear Market Analysis- Big Picture
I have now moved the rolling top scenario up into the most likely outcome for the stock market. There is always a possibility that the blow-off top scenario could reemerge, however with each passing day it appears less likely. Instead we have been witnessing an ongoing stream of data points which point towards a lower market and a downside break in the market looming ahead. The bear market began on October 4th as defined by Dow Theory. It is forming a massive rollover top at record historical valuations. Once a Dow Theory sell signal is triggered it is normal for it to continue until the bear market purges the excesses which exist in the economy.
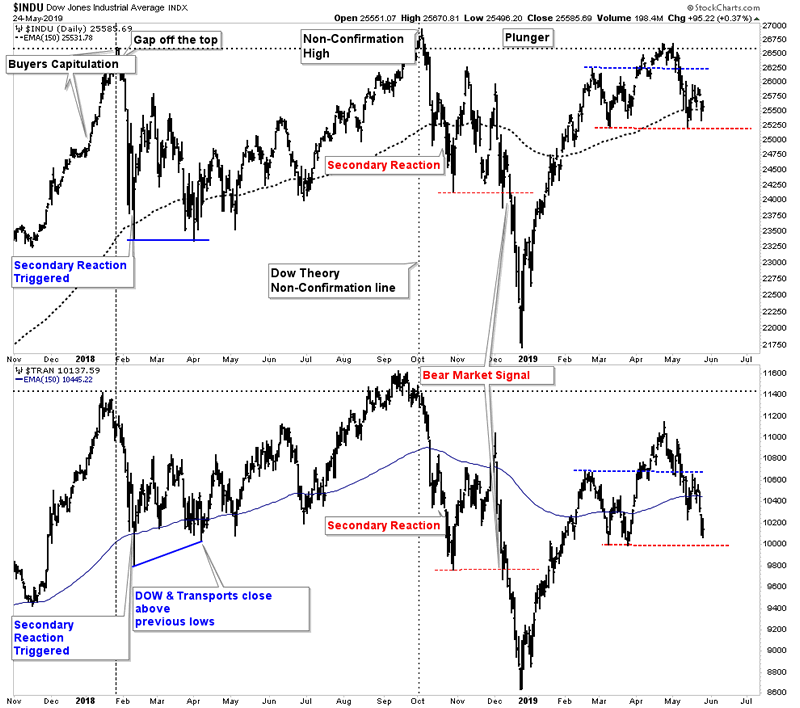
How severe of a bear market can we expect? According to John Hussman’s analysis, for the market to reach normal bear market valuations at its lows it would require the S&P 500 to drop 60% from its current levels. Keep in mind that would just be a normal bear market valuation. Historically if a bull market becomes grossly over extended, as is today’s market, the next bear market can be expected to overshoot to the downside. One can only imagine what downside levels could be reached.
Let’s review the chart above: The rally since December 24th 2018 can now be seen as simply a bear market rally. It was a BMR of the caliber witnessed from December 1929 to April 1930. Once (if) the Dow and Transports violate the red dashed line extending from the late March lows it will re-confirm the bear market is intact. Mind you the DT bear market sell signal of December 14th has never been annulled so this will be a re-confirmation of that signal. A powerful omen.
Post 1929 Crash BMR
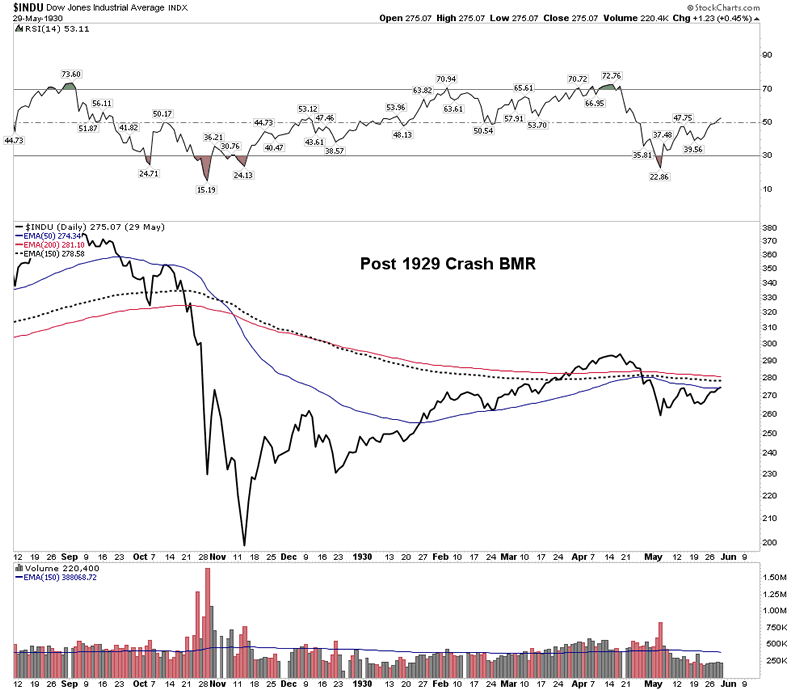
The post 1929 crash BMR served to reignite bullish psychology back in 1930 similar to what the rally since December 24th 2018 has done today. Both within the confines of a bear market.
Retail market investors still think we are in an ongoing bull market. That’s typical bear market phase I market psychology. The market will transition into bear market phase II sometime after the December lows have been violated. About one third into Phase II we will witness a point of recognition (POR) of the bear market by the investing public. Frankly, I don’t see this occurring until likely 2020 as once the December lows get violated there will be a lot of organized support for the market in an attempt to hold it up. However, time will eventually erode this support and open the flood gates with a crack to the downside which will be recognized as the POR.
In the below chart we see the interplay between the Dow and Transports for the BMR which began December 24th. We have seen in previous breakdowns the transports leading the move down just like we see in the current action.
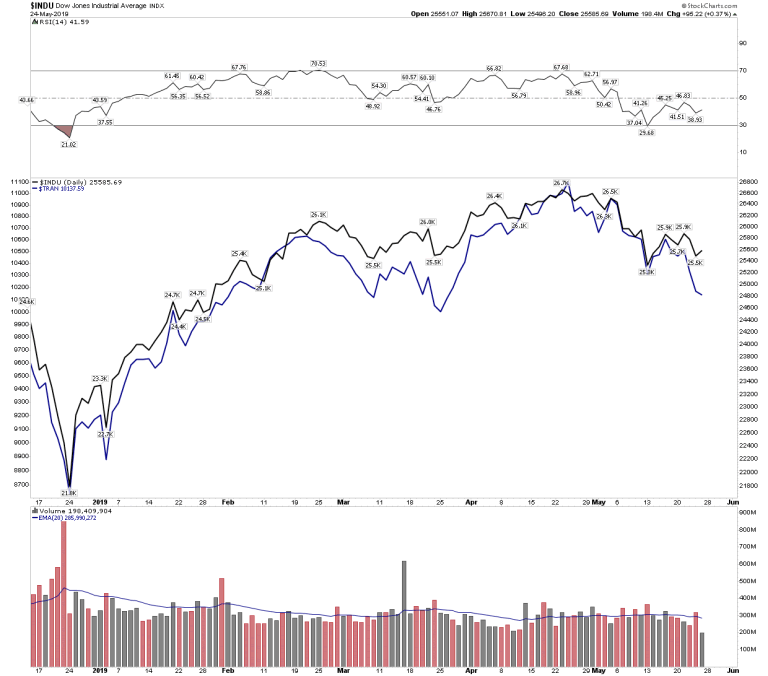
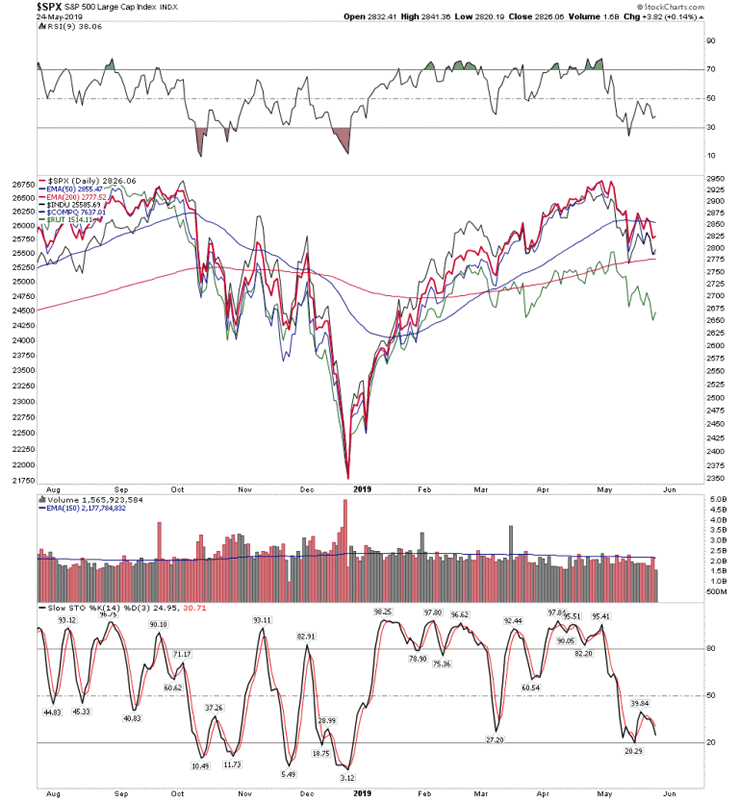
Moving average momentum can be seen waning, setting itself up for a possible fall…Sell in May.
Below we see the small stocks in the Russell 2000 rolling over first:
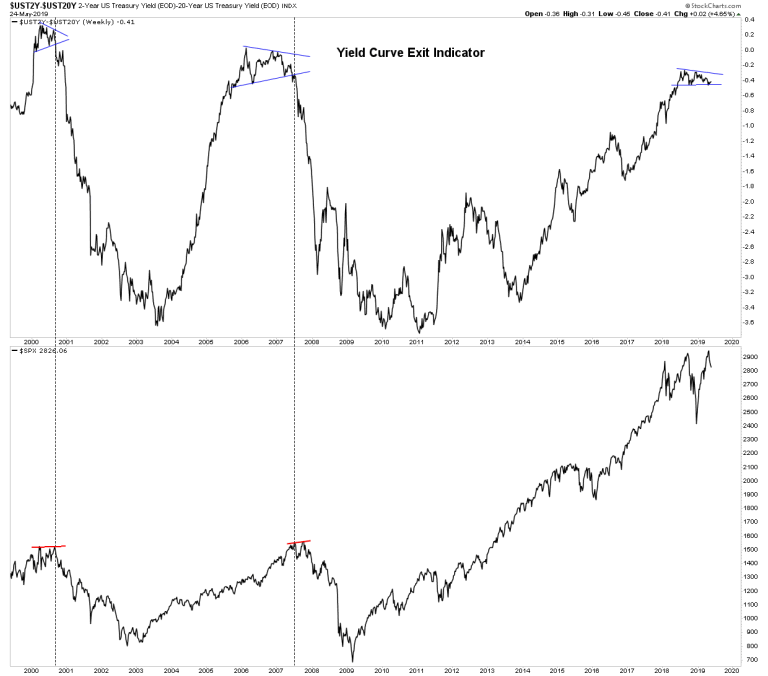
Yield Curve Exit Indicator– Still holding off and hanging on by its fingernails.
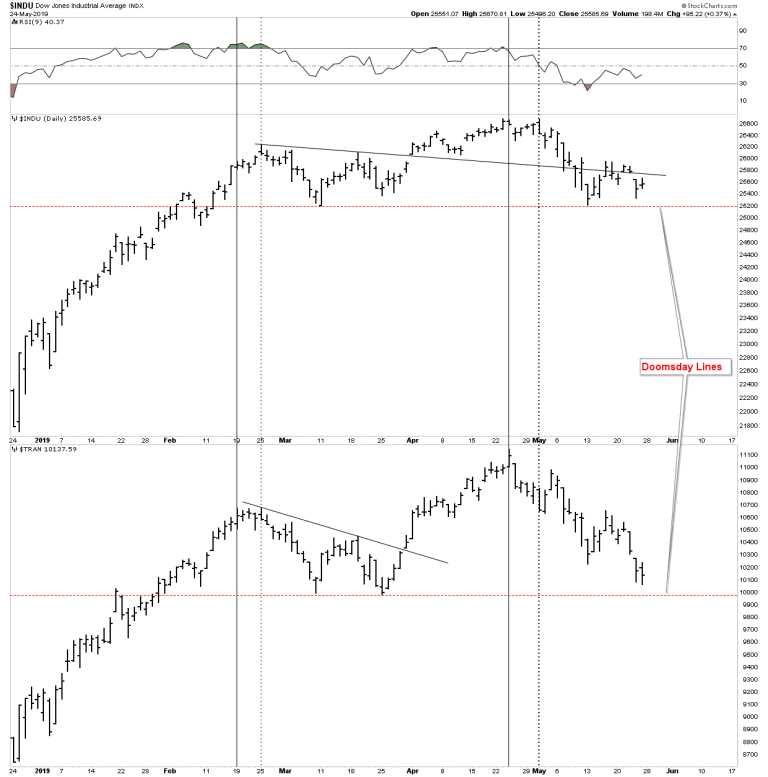
Doomsday Lines
Below we see two doomsday lines when if both violated, on a closing basis, will re-confirm the Dow Theory Bear Market Sell Signal. Also note by observing the vertical lines how the transports fell off and failed to reconfirm the Dow on the last two highs.
The Rounding Rollover Top- The Lead Scenario
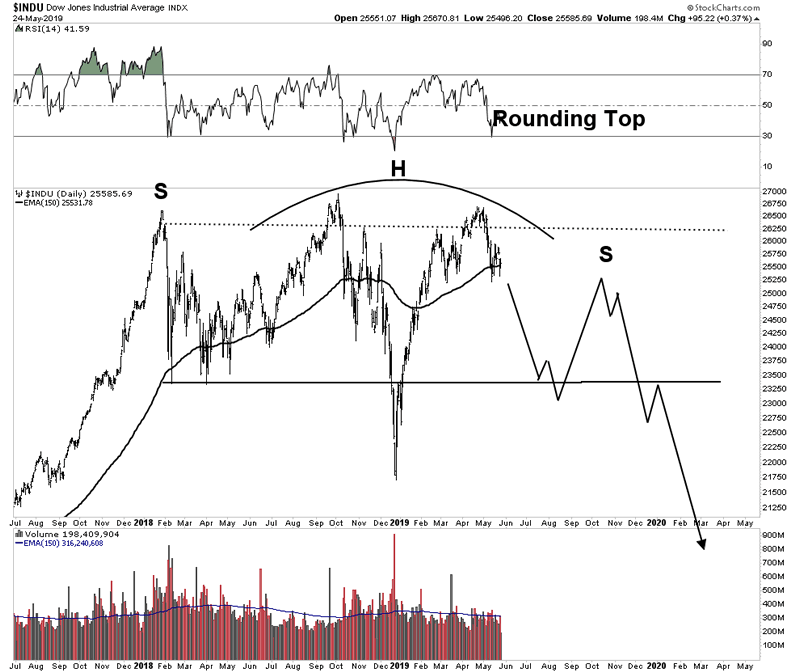
The Blow Off Top scenario now seems to have been put on the shelf. Conditions and seasonals appear to be pointing towards a decline now… Sell In May and Go Away.
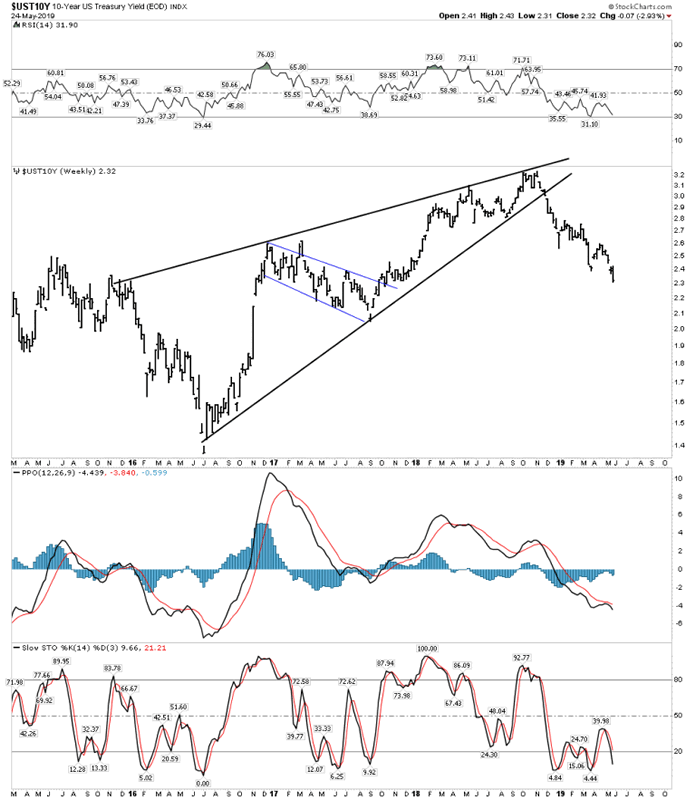
The Bond Market is telling us a recession is encroaching.
The tariffs put upon Chinese goods now equate to a loss of purchasing power of $350/month for the average American family. Considering the median household income in the US is $61,000/year the loss of $4,200/year of purchasing power due to the tariffs is huge. Make no mistake about it, that’s a 6.8% new tax on the average American family. The bond market sees this amongst other factors pointing towards a recession. Below we see rates in free fall reflecting a weakening economy:
10 Yr UST
Long Duration 30 Yr USB
The 30 yr bond now breaking out:
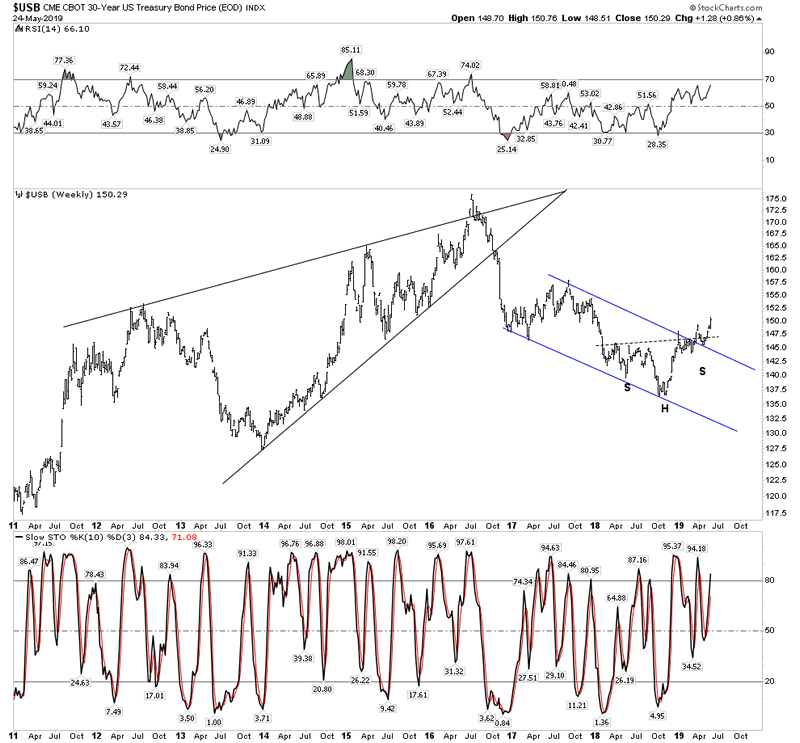
Bottom Line Bonds– Recession is looming and bonds are still in a bull market after 36 long years.
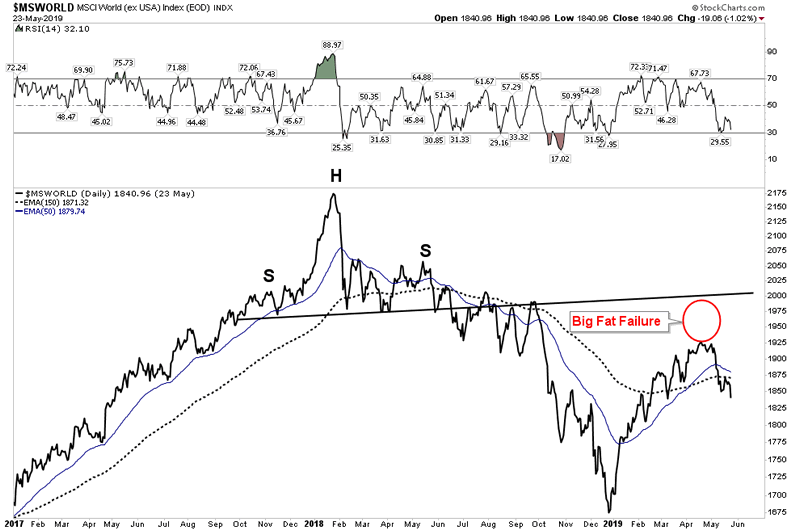
World Stock Markets- Rejoining the downside
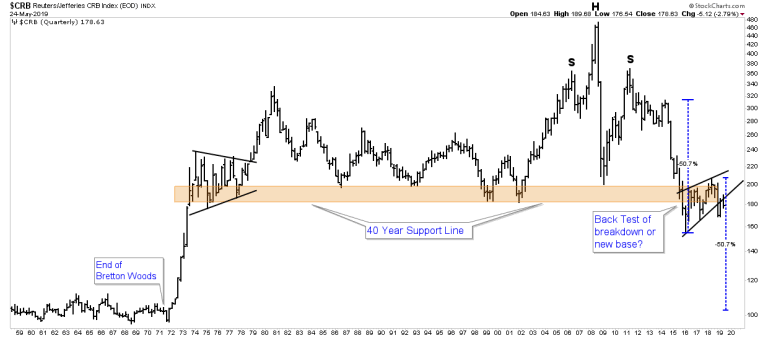
Commodities- Downturn Resuming
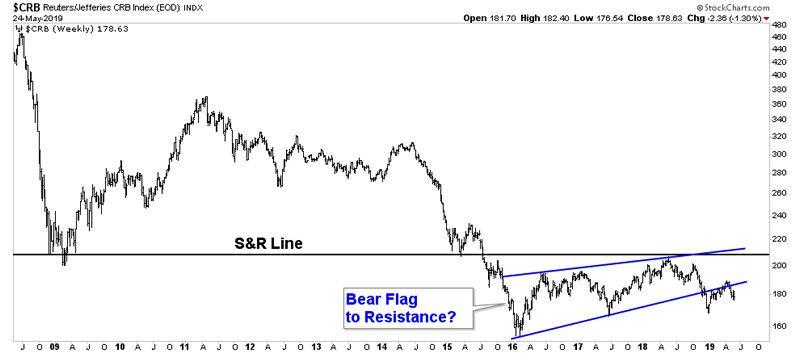
We start with what I refer to as the scariest chart on the planet. It’s my version of Rambus’ long term CRB index. In a post bubble contraction the real price of commodities decline while the real price of gold rises. For some time now I have recognized the possible message of the below chart being that once the back test of the 40 year support line is over there is a possibility that commodities could crash down to the level of the early 1970’s. The rise of commodities over the past 3 years has been perceived as a new bull market, however this chart shows that it may only be a back test of the violated 40 year support line.
In the chart below we can see an expanded view of that back test. Instead of looking like a new bull market it actually looks like a lame attempt to back test the S&R line and that attempt is now complete.
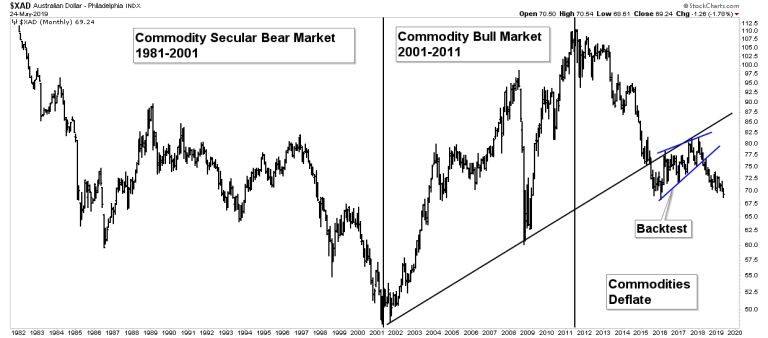
Aussie Dollar- Resuming its decline.
The Aussie Dollar is the commodity currency of the world. That’s because a large part of the Aussie economy and currency flows are tied up in commodities. The AUD leads commodity prices and the chart below shows it’s headed down:
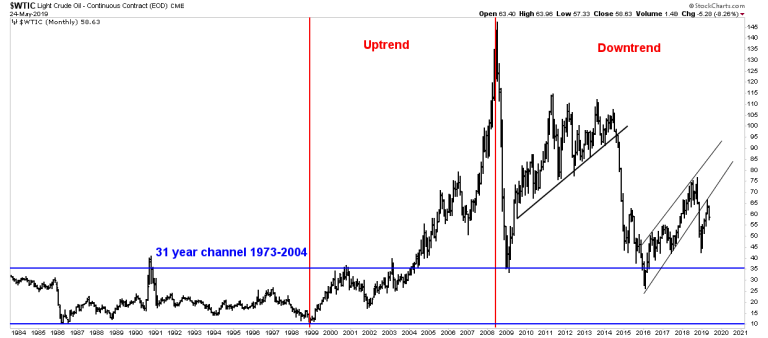
Oil- Resuming its third cyclical bear market within its long term secular bear market. Below we see the long term trends in oil. After the break above its 31 year horizontal trend channel it embarked on a classic 10 year bull market. This bull market had 3 clearly defined phases (not depicted) and ended in a parabolic blow off. Parabolic blow offs typically are followed by secular bear markets and oil was no exception. It is my analysis that oil has now resumed its third cyclical bear market within the secular bear market which began 11 years ago. Towards the end of this cyclical bear market, I believe life time opportunities will present themselves to investors in the oil patch. Keep one eye on this bear market looking for future opportunities.
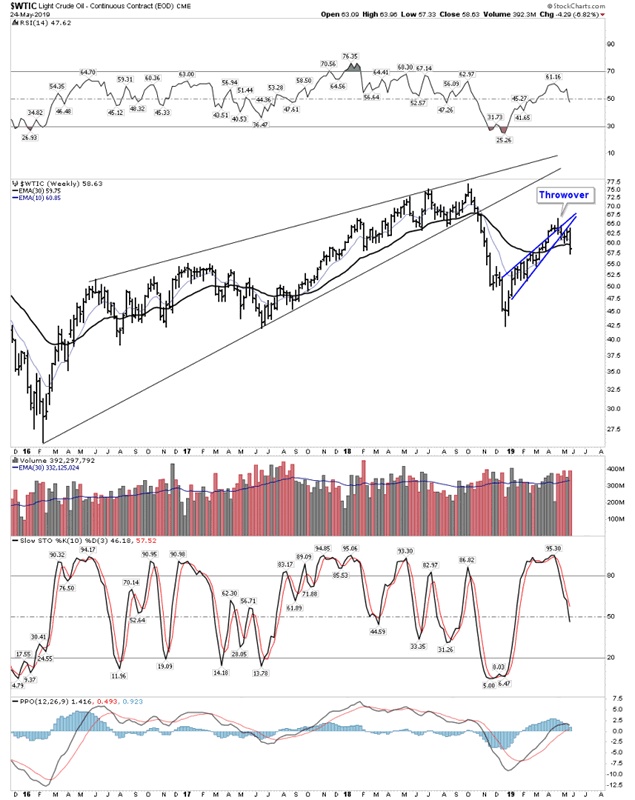
Below we see the 2.5 year bull market in oil with its September 2018 top followed by a new cyclical bear market in oil. It started with a hard drop off the top followed by a 4 month bearish rising wedge with a throwover top. The bear market decline appears to have now resumed.
Five Short Sale Candidates for the next leg down
In the early stages of a bear market it is typical for declining stocks not to have much follow through. We saw this over the past week as stocks that suddenly drop quickly recover much of their lost ground the next day. I experienced this with the shorts I have out. So often the best course of action is to take profits immediately rather than wait for follow through. My preferred method to short in this stage of the bear is to put on a bear call spread slightly in the money. I buy a call well above the market to cap any potential loss and sell an in the money call close to strike to capture maximum premium. This way even if the stock just goes sideways the trade should make money as the time value of the premium decays over time.
Boeing– If it’s not Boeing I’m not going (unless its a Max)
Boeing is in Big Big Trouble. In my view, it’s a company that got lazy and lost its way. The Boeing design philosophy has always been the pilot can turn off all automation and simply fly the airplane. This allows the pilot ultimate rule over the aircraft. Not so with Airbus. Airbus pilots like to joke that they simply are a voting member where the computer retains the right to nullify their vote. When Boeing designed the 737 Max they departed from their time tested operational philosophy of the pilot being in control… and THEY DIDN’T TELL THE PILOTS!!!
Seriously… How crazy is that! Well it resulted in 2 back to back crashes of fully loaded aircraft. Now they have hundreds of 737 Max’s sitting in the desert awaiting a fix and recertification. Sure they can always buy off Congress and the FAA I suppose, but good luck trying to do that with the civil aviation authorities in Europe and China. Especially in the middle of a trade war! Bottom line on Boeing is the stock got way over priced and hyped then disaster struct. There is no quick fix, meanwhile the lawsuits stack up and hundreds of A/C sit in the desert. The chart is a clean picture of a measured move down to the 305 level.
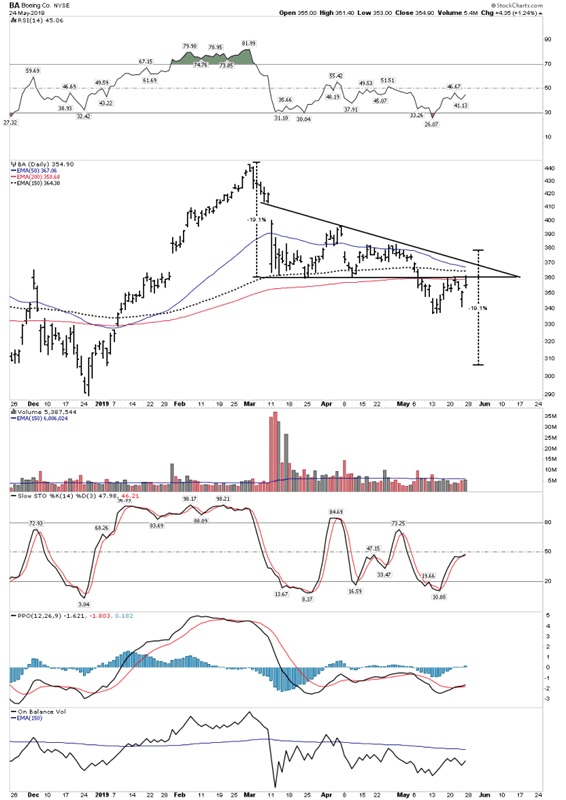
Note how springy the backtest has been. That’s due to the early stage of a bear market… little immediate follow through.
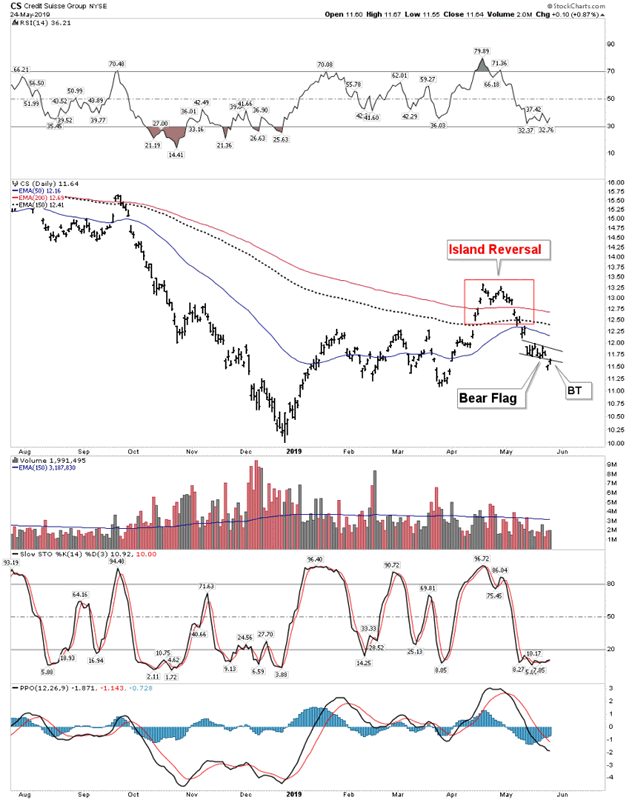
Credit Suisse- CS
Everyone knows that Deutsche Bank (DB) is full of insolvent credits and is on deaths door. Think of DB as Lehman on the Rhine. Well DB is not the only one chock full of insolvency. Credit Suisse is DB’s kid brother, let’s just call CS “DB in drag”. CS had a nasty breakdown on Thursday with a BT on Friday setting it up to be shorted again:
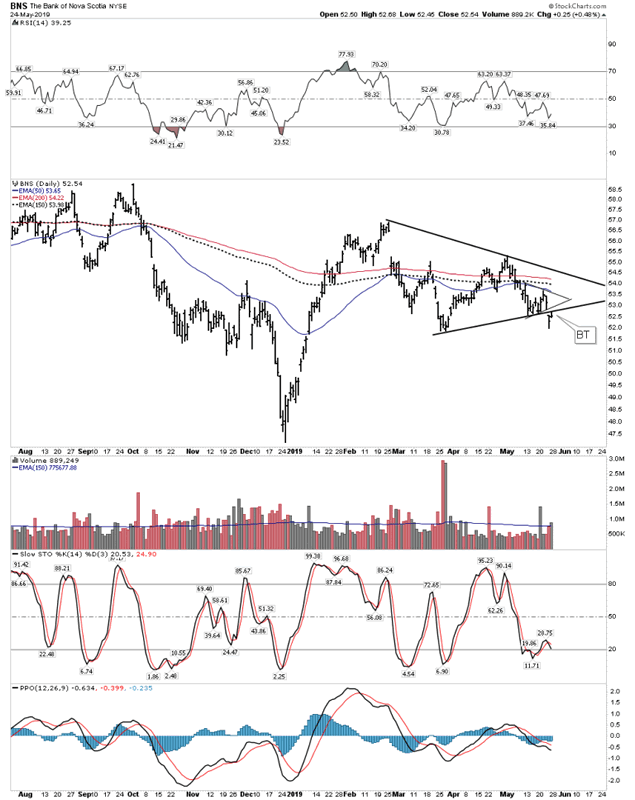
Bank of Nova Scotia
This is a play against the Canadian housing market. One could also look at RY, BMO, TD or others, however BNS is a bit more advanced in the process of breaking down. We always prefer a short to have come off of its top, then rally back up and finally drop down below its 30 W EMA. Once it’s unable to rally back above its 30 W EMA it’s then ready to short. BNS fits the bill:
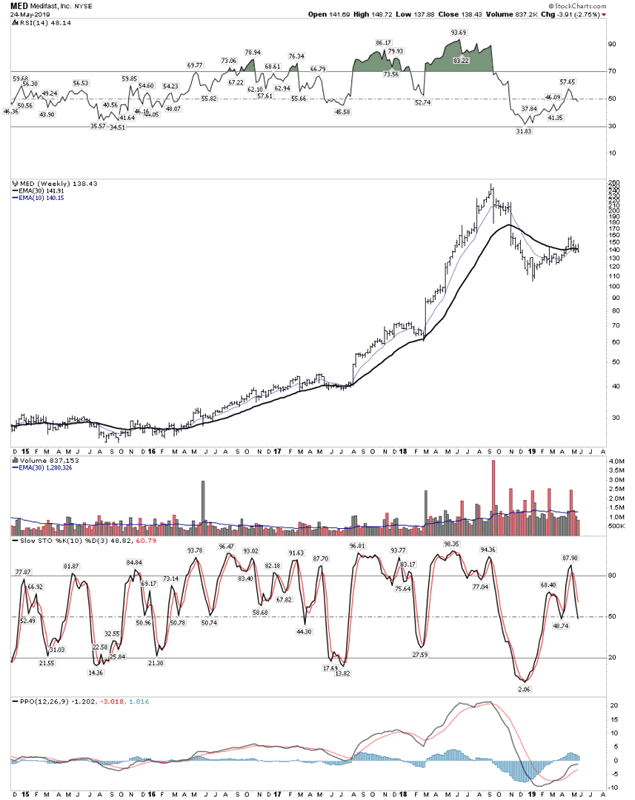
Medifast- MED
Medifast is a Jim Chanos short. That’s about all one needs to know outside of chart analysis. We see a nice island reversal top followed by a failing retracement of its breakdown. 30 W EMA now starting to roll over. It just now needs to drop below its horizontal triangle that is depicted. A short seller could take half a position here then the second half after it backtests a break below the triangle.
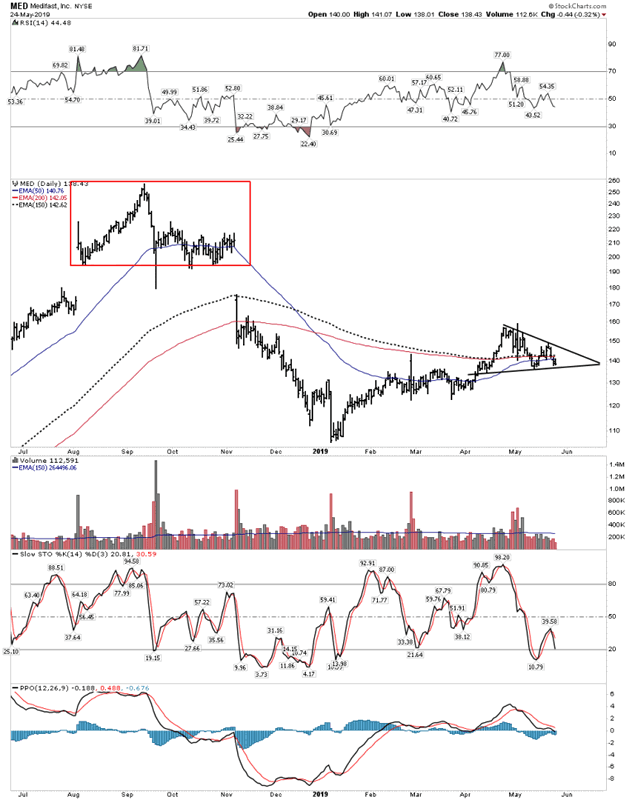
A longer duration chart gives more perspective of just how much could come unglued once the price gets turned down below the 30 W EMA.
Russell 2000 ETF IWM
As seen earlier the IWM is the lagging index for the general stock market. The chart below looks like it is finally setting up to unload to the downside.
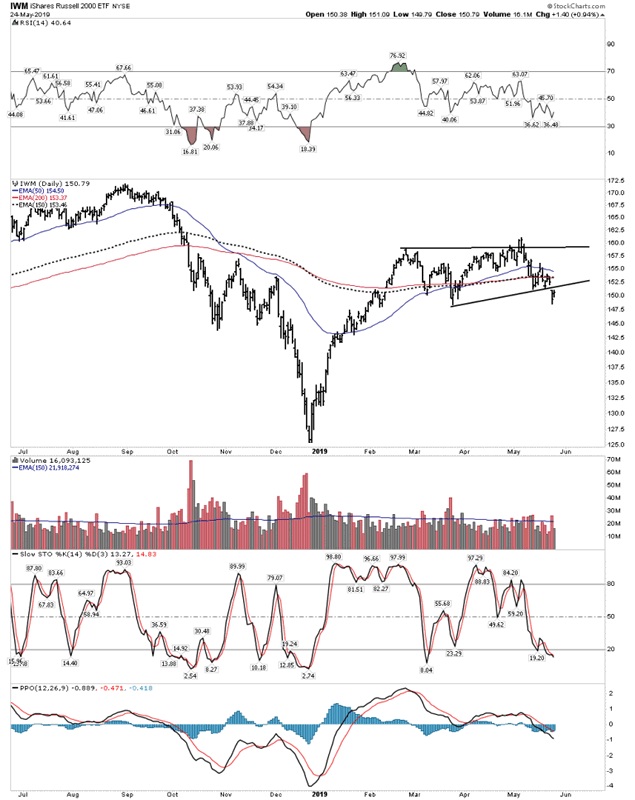
Note its drop on Thursday with BT on Friday. I would expect this to float around for a few days before resuming downward action. It finally is unable to remain above the 30 W EMA. Below is a longer perspective:
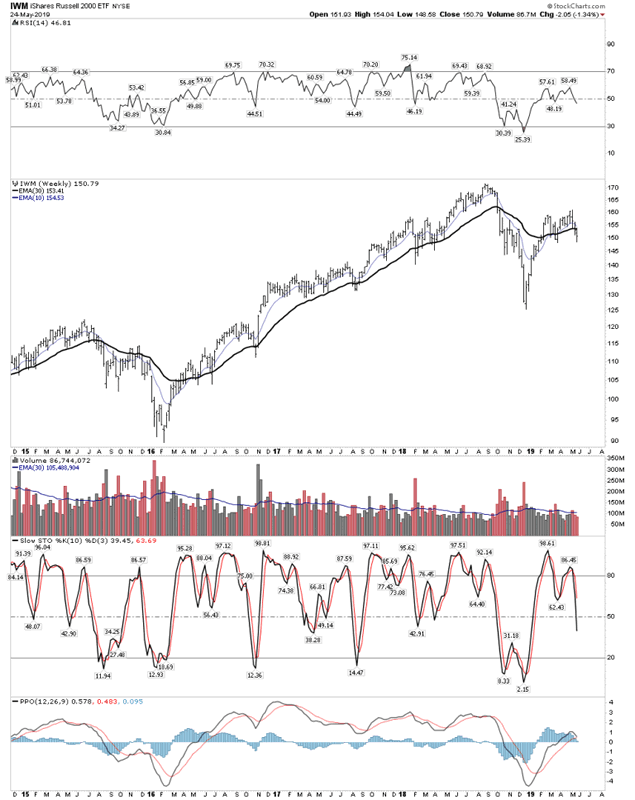
Note weekly stochastics and PPO in a downward configuration.
These are just five stocks which appear ready to short in the next leg down. There are plenty others on the dishonorable list such as IYT, FDX, UPS, NVDA, COP, GM, BAC, plus many others.
Update on the PM stocks
It is important to understand that the PM sector is the opposite side of the coin of the general stock market. This is because of the time tested principle that gold’s real price declines in a financial bubble and rises as the bubble deflates. We can see from the above analysis that the bubble is beginning to degrade. We see this in the stock market, the commodities and the general economic data. Gold is on the opposite side of this equation and has been establishing a base for the upcoming bull market associated with a post bubble contraction.
Presently the stocks are still struggling to put in a bottom and have not yet made the turn. Newmont, however appears to have done so:
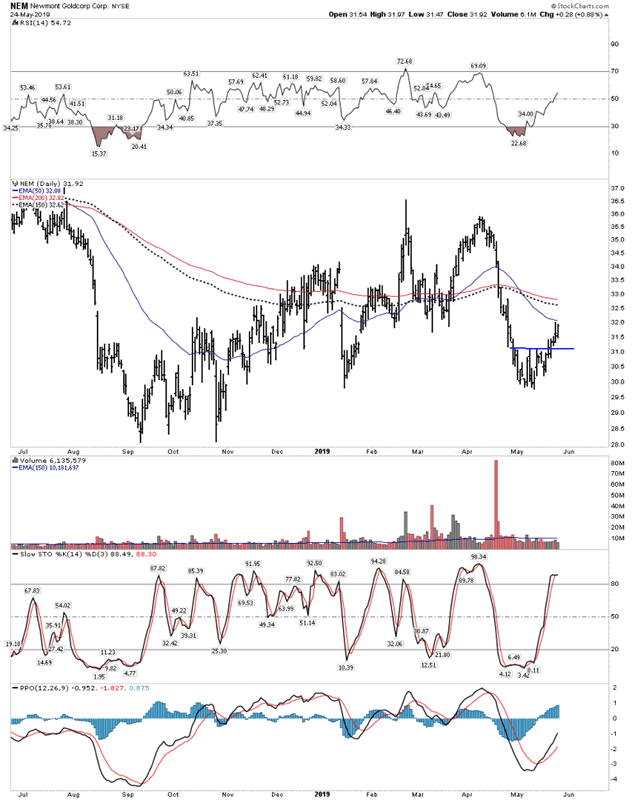
The main risk to the PM shares is that they have a certain vulnerability of declining initially with a sell off of the general stock market. This is why I have concentrated my positions amongst quality shares and royalties, as they should be less vulnerable.
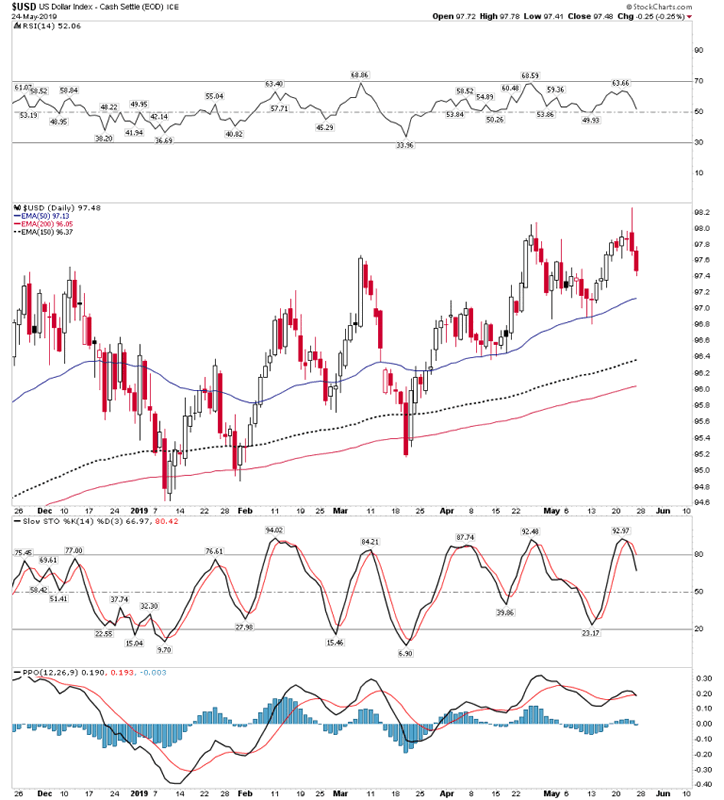
Geopolitical factors also appear to be lining up to assist the turn in gold. US-China trade relations have broken down. I presently am writing this report from Shanghai China. From this vantage point it appears that the trade struggle is not about Trump’s “The art of the deal”, but instead Sun Tzu’s “The art of war” where the Chinese don’t meet force head on, but instead respond in other forms. These forms could include selling US Treasury debt and using these funds to acquire gold. Putin’s Russia has already completed this operation of selling all of their US Treasury bonds and using it to buy gold. The USD seems to have picked up on this threat putting in a bearish shooting star candle top followed by a hard down day. Perhaps the end of an extended upward move:
The Spec gold bears are getting excited about a potential downside move in gold, however strategic serious money is moving into gold. Gold is the long play, permanent money recognizes this and is positioning itself. One should ask oneself which group should you be in?
All the best
By Plunger
FREE TRIAL - http://rambus1.com/?page_id=10
© 2019 Copyright Rambus- All Rights Reserved
Disclaimer: The above is a matter of opinion provided for general information purposes only and is not intended as investment advice. Information and analysis above are derived from sources and utilising methods believed to be reliable, but we cannot accept responsibility for any losses you may incur as a result of this analysis. Individuals should consult with their personal financial advisors.
© 2005-2022 http://www.MarketOracle.co.uk - The Market Oracle is a FREE Daily Financial Markets Analysis & Forecasting online publication.