


Global Multi-Market / Asset Charts Review
Stock-Markets / Financial Markets 2019 May 26, 2019 - 06:44 PM GMTBy: Gary_Tanashian

 First off, a wish to all readers for a happy Memorial Day weekend as we remember loved ones lost in battle and otherwise. Memorial is not a US thing, it’s an everybody thing.
Today we take a look at various markets and assets using daily charts of the associated ETFs.
The real work in determining the state of the markets going forward will be done by evaluating internals measures like sector leadership (e.g. our SOX>NDX>SPX leadership chain), inter-market and inter-asset ratios (e.g. our ongoing gold ratios analysis), macro indicators (e.g. the recent notable drop in inflation expectations) and a whole host of other hidden markers to be tracked and updated (NFTRH is constantly on that job looking forward to the potentials, as opposed to in review or in rear-view). Also, let’s not forget sentiment analysis, which led us to the current correction. It will also come into play going both ways in the weeks and months ahead.
But sometimes it’s fun to just check out the charts and see what we see.
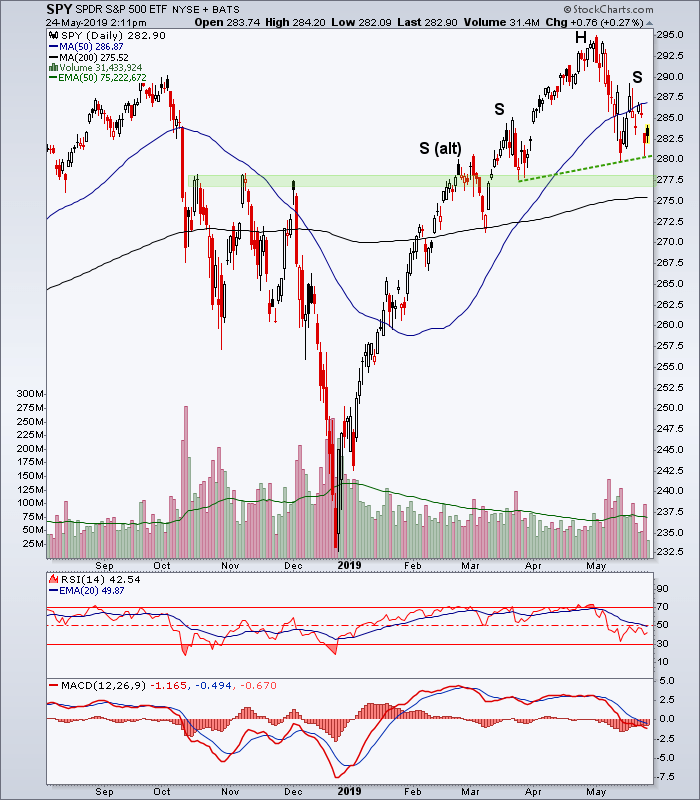
Beginning right here in the US with the broad market, SPY is in a small potential Head & Shoulders pattern, with an alternate left shoulder should it turn out to be what self-important TAs like to call a “complex H&S”. That would create a larger H&S scenario with a lower target, which we’ll reserve for NFTRH if the time comes to activate this still unconfirmed H&S. The dashed neckline is shown for the little guy and should the big one come into play the black SMA 200 could act as a neckline there.
For now, SPY is above key support areas (after failing the SMA 50) with the most important being the green shaded zone and the SMA 200. RSI and MACD are not at all attractive and down volume has dwarfed up volume.
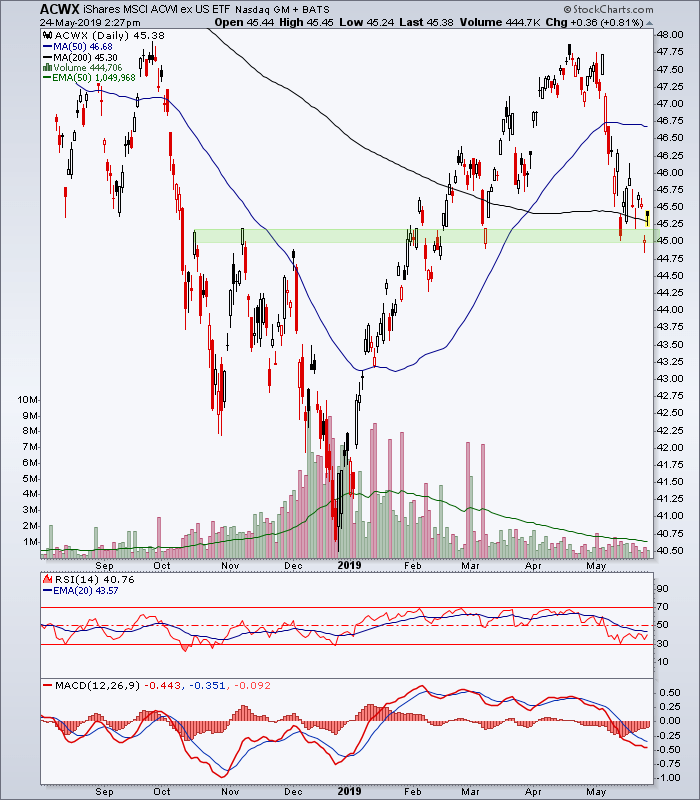
The Global Stock Market (ex-US) has declined to a lateral support shelf, which it (ACWX) needs to hold to avoid significant technical damage. Note how unlike with SPY above the 200 day moving average never did turn up and is still sloping down. It would not be a good look for ACWX if 45 gives way.
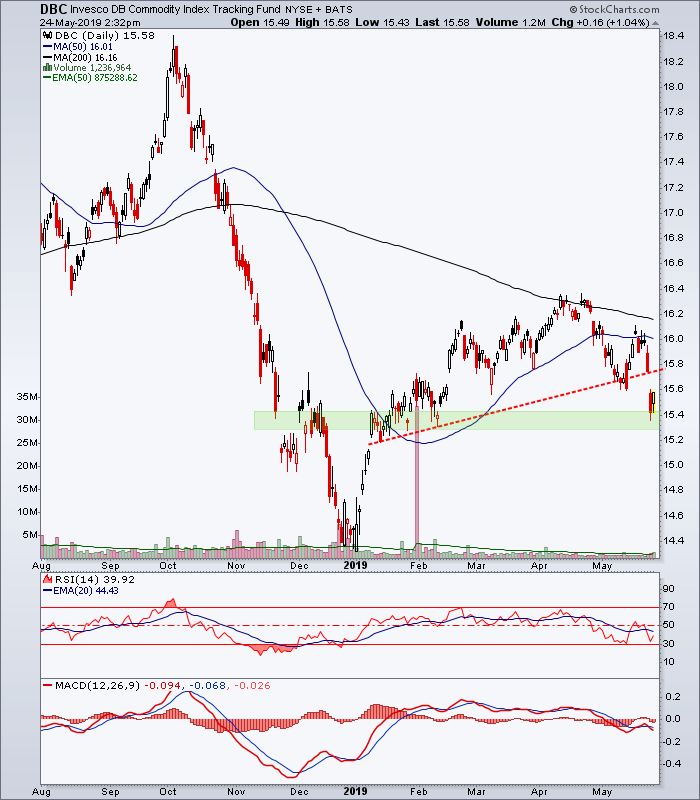
Broad Commodities have sustained an ugly breakdown this week and are grappling for support at the lateral cluster from December-February.
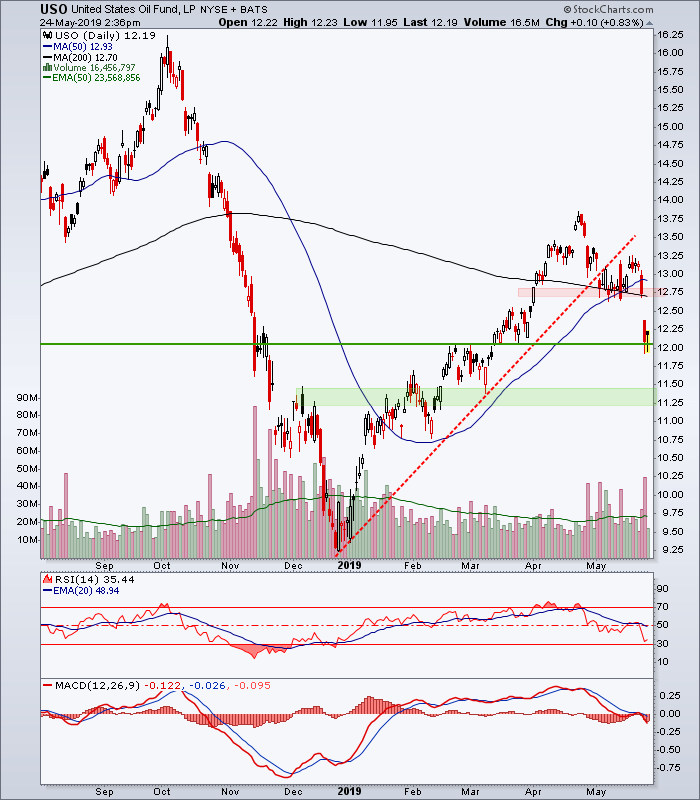
Crude Oil (USO) drove the commodity drop and is at a support area. It would be unusual for a market that drops so abruptly on such volume to simply hold support and rise anew in the short-term, but playing it straight let’s note support at 12, big time resistance at 12.75 and better support at 11.25. The candle is a Hammer, which gets some people excited.
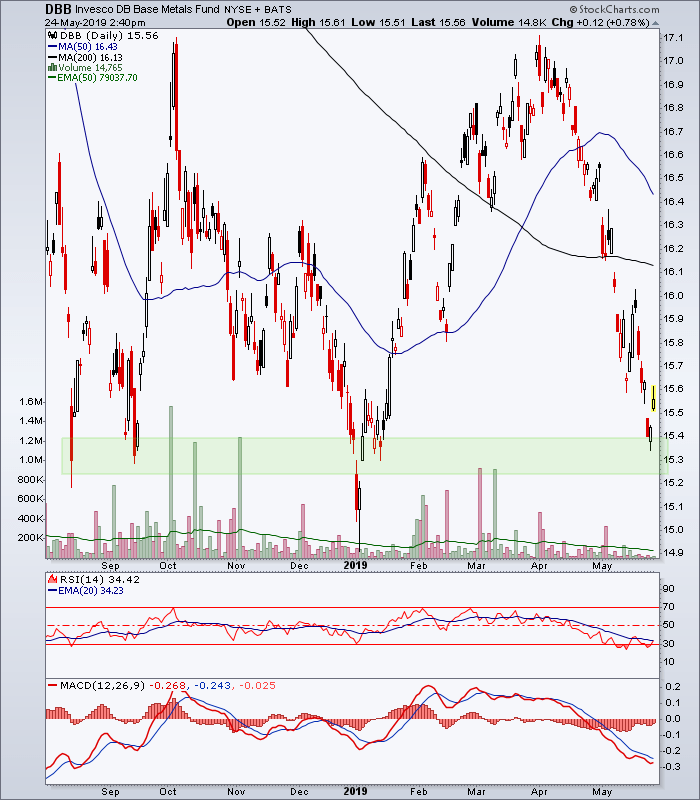
Base/Industrial Metals (including Doctor Copper) have been dropping hard of late and the signalling of that is counter-cyclical. Support for DBB is critical to keep the picture from degrading further.
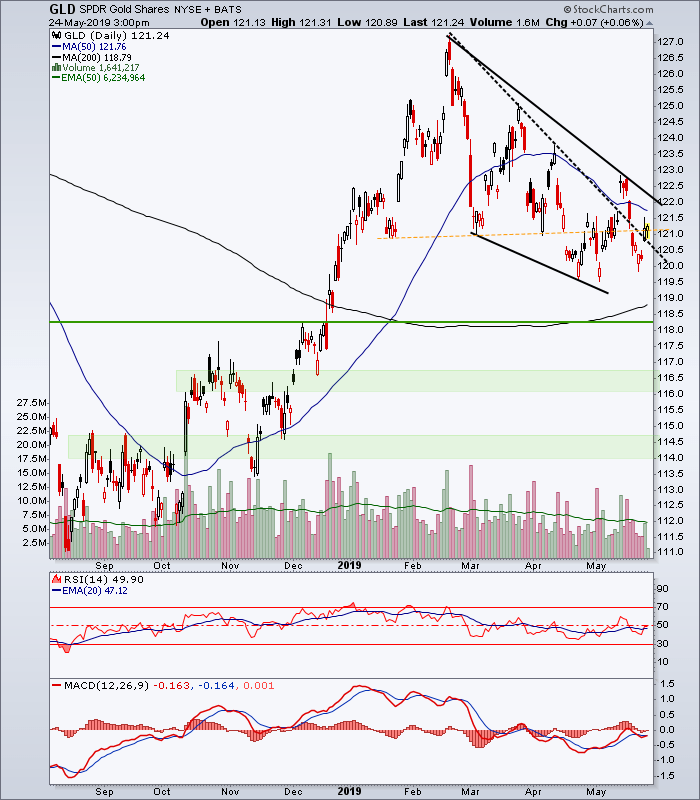
Gold looks relatively constructive, as it would during a risk ‘off’ counter-cyclical macro lurch. You can see GLD’s support parameters beginning at the up-turning SMA 200 and you can review the exact parameters as presented in Thursday’s post showing Copper, Gold and Silver futures charts. The work gold still needs to do to get bullish is to break the SMA 50 and then the top wedge line.
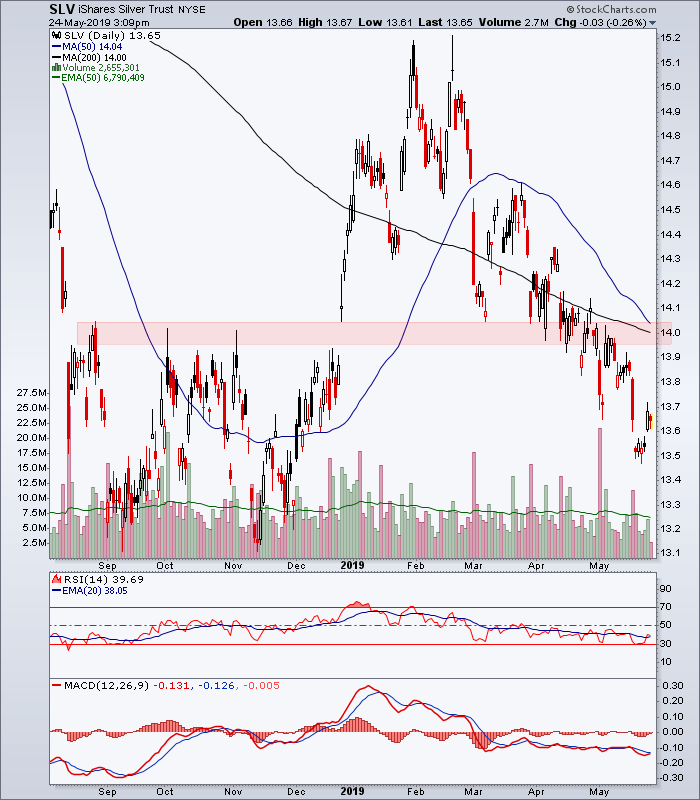
Silver is last but not least, especially since I’d expect it to move best when the precious metals are ready if the current disinflationary bout eases on the macro. Unlike for gold, silver’s recent CoT data have been constructive [update: this week’s CoT improved yet again, with a small caveat. We’ll review in NFTRH 553 on Sunday] and one fundamentalist I trust, Keith Weiner, has the fundamental prices of both gold and silver higher. Of course sentiment indicators like CoT and fundamentals will be proven in price in their own time. The chart shows no sign of an actionable upturn.
As to the chart, SLV tanked last week. It has since bounced but 14 is rock solid resistance and silver could have lower levels to explore before the correction ends. Again, the Copper, Gold and Silver futures post gives the levels.
Subscribe to NFTRH Premium (monthly at USD $33.50 or a 14% discounted yearly at USD $345.00) for an in-depth weekly market report, interim market updates and NFTRH+ chart and trade setup ideas, all archived/posted at the site and delivered to your inbox.
You can also keep up to date with plenty of actionable public content at NFTRH.com by using the email form on the right sidebar and get even more by joining our free eLetter. Or follow via Twitter ;@BiiwiiNFTRH, StockTwits or RSS. Also check out the quality market writers at Biiwii.com.
By Gary Tanashian
© 2019 Copyright Gary Tanashian - All Rights Reserved
Disclaimer: The above is a matter of opinion provided for general information purposes only and is not intended as investment advice. Information and analysis above are derived from sources and utilising methods believed to be reliable, but we cannot accept responsibility for any losses you may incur as a result of this analysis. Individuals should consult with their personal financial advisors.
Gary Tanashian Archive |
© 2005-2022 http://www.MarketOracle.co.uk - The Market Oracle is a FREE Daily Financial Markets Analysis & Forecasting online publication.