


How Fed Interest Rate Cycles Exponentially Reduce Long Term Wealth Creation
Interest-Rates / Economic Theory May 08, 2019 - 04:14 PM GMTBy: Dan_Amerman

 The most historically reliable way to create long term wealth is the reinvestment of cash flows over time, as earnings are earned on earnings, which are earned on earnings.
Compound interest is the best known example, but the same principle of compounding cash flows is also the most powerful and stable source of wealth with the stocks and real estate over the long term as well.
Reinvested (and increasing) dividends are a more important and stable source of stock market wealth than price gains. Reinvested (and increasing) net cash flows are the most stable and important source of wealth with real estate and REIT investments as well.
However, what was taken for granted for many decades - is no longer available. As a result of Federal Reserve policies, only a small fraction of the historically average power of this wealth building engine still remains. In this analysis we will examine the mathematical implications of publicly stated Fed intentions if there is another recession, and look at the extraordinary implications for investors.
This analysis is part of a series of related analyses, an overview of the rest of the series is linked here.
Building Wealth With The Reinvestment Of Cash Flows
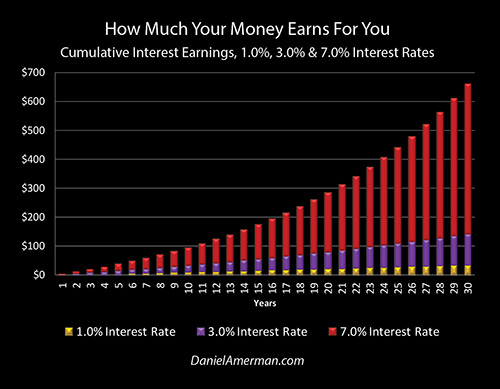
A simple example of this powerful wealth creation machine can be seen in the graph below.
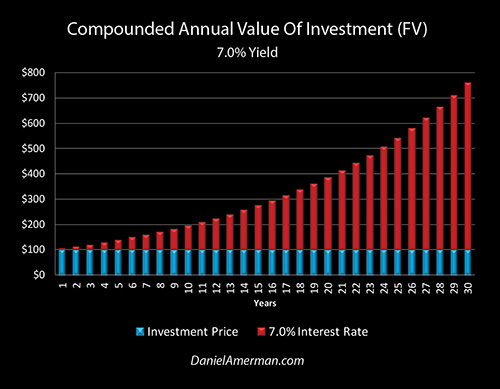
The blue bar is our starting investment of 100 dollars. The red bar is cumulative interest income, with reinvestment (i.e. compounding) at a seven percent rate of return. The 7.0% interest rate is not random, but is instead what could be called historically normal - before the financial crisis of 2008.
During the 36 years (inclusive) from 1962 to 2007, the average interest rate on a 10 year U.S. Treasury bond was a little over seven percent. For most of the lifetimes of most the people reading this - it is was completely normal to be able to earn a 7% or greater return without even needing to take any credit risk.
Normality used to be that $100 would become $107 in a year. That $107, invested for another year at 7%, would become $114.49.
In 10 years, $100 would become $197. The total value of the investment with reinvested earnings would grow to $387 in 20 years.
If we go out 30 years - for say, a 50 year old investing for retirement expenses at age 80 - then simple normality with a very high quality investment used to be $100 becoming $761. That $661 in earnings and earnings on earnings is not only much larger than the initial $100 investment, but its creation was relatively stable. Investments where returns are based solely on price movements are inherently unstable, while investments where reinvested cash flows are the primary driver of wealth creation, smooth out the price risks over time and are inherently more stable.
That was the past, but the present is quite different - and this is a matter of Federal Reserve policy. The Fed slammed Fed Funds rates down to their lowest levels in 50 years in the attempt to contain the damage from the collapse of the tech stock bubble and the recession of 2001.
Facing the much worse situation of the financial crisis of 2008, the Federal Reserve took the unprecedented steps of zero percent interest rate policies and quantitative easing, i.e. creating trillions of dollars of new money out of the nothingness and using those dollars to manipulate interest rate levels.
Currently we have interest rate levels that are higher than they were in the zero percent years, but are still far below the historic average. If we go back to the fall of 2018, then 10 year Treasury yields were briefly in excess of three percent, and in early 2019, 30 year Treasury yields were around three percent.
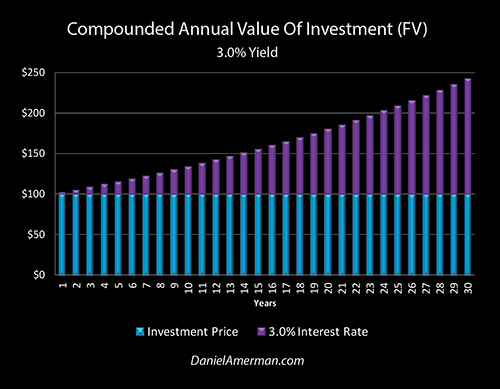
Let's take a look at what happens to our interest earnings when we have the 30 year reinvestment of cash at a round number current rate of three percent. In this case the blue bars are still our starting investment of the hundred dollars, and the purple bars are the earnings - and the reinvestment earnings on the earnings - for that 100 dollars.
As is visually obvious the purple bars of compound interest income are far lower at our current interest rate levels, than is the historic average. In 10 years, $100 now becomes only $134. When we go out 20 years, our total investment is now worth $181, and if we go out 30 years, the total is now $243.
The Impact Of A Potential Recession
An issue is that there appears to be a pretty good chance that we could have a recession in the next year or two. As explored in earlier analyses in this series, we already know what the Federal Reserve intends to do in such a case.
The first step will be to - on a highly likely basis - move interest rates straight back down to (at least) zero percent (analysis link here). To the extent necessary, the Federal Reserve also intends to immediately create a new round of quantitative easing (analysis link here), stack the new QE on top of the old QE on the Federal Reserve balance sheet, use the newly created money to buy medium and long term U.S. Treasury obligations, and thereby bring down the yields faster and farther than the market by itself would do.
With those being the Fed's intentions, for this illustration we will move the assumed yield down to 1.0%, in the event of another iteration of the business cycle, and another recession.
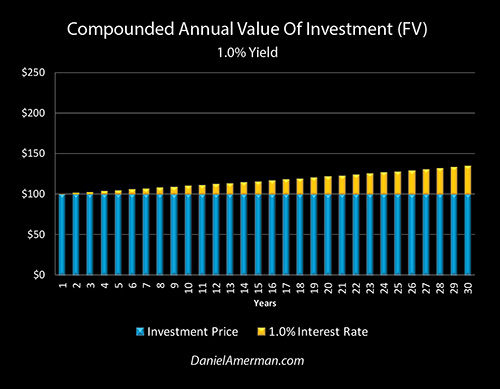
We now have the gold bars of cumulative and compound interest earnings at a one percent yield. If one scrolls back and forth between the red bars of what was historically normal for most of our lives - and the gold bars of what may be on the way with a 35th round of recession (since 1854, link here) - the difference is visually stunning.
The normality of the single most reliable method of building wealth over the long term has been eviscerated, there is almost nothing left. One hundred dollars becomes only $110 in ten years, $122 in 20 years, and a mere $135 in 30 years.
Using the reinvestment of cash flow earnings is the most powerful wealth creation engine in financial history - and this is true not only for bonds, but also for stocks and real estate (albeit with somewhat differing specifics).
What is illustrated above is the annihilation of this historical wealth creation engine for the investors of an entire nation (and much of the world) as a publicly stated matter of policy.
Now, it is of course true that the Federal Reserve is not coming out and saying that their intention is to destroy the engine of wealth creation for the nation for years and potentially decades to come. They aren't putting out the press releases about how every retiree and retirement investor in nation is likely to see stunning declines in wealth creation and financial security as the result of their policy choices.
But nonetheless, the one is the mathematically necessary result of the other. To see just how simple - and how necessary - this relationship is, I'm going to have to ask the reader to join me in a brief foray back into the basics of mathematics.
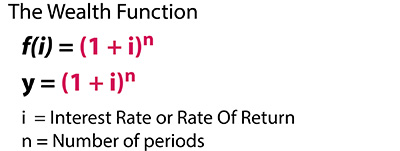
The Wealth Compounding Function
One of the fundamental building blocks of mathematics is functions, and the general form of the function that determines how Fed policies transform wealth creation is shown in the equation below.
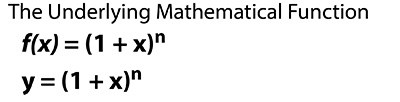
This can also be expressed as y = f(x), where f(x) = (1 + x)^n and it is a very simple function, albeit a nonlinear function. The input or independent variable is X. Whenever the value of X is changed, then we also get a direct change in the value of the output, also known as the dependent variable of Y. Because this is an exponential function, relatively small changes in X can produce radical changes in Y, and this is particularly true at higher values of N.
Now let's go from the basics of mathematics to the foundation principles of financial mathematics, and see why some of the biggest changes in our lifetime have already occurred - as well as why we may be just getting started.
For finance, this becomes the compound interest function, and the independent variable of X is now replaced with the specific term of "i", the effective risk free rate of return. If one wants to get technical, "i" is generally considered to be overnight Treasury yields, however, given the extremely close relationship between overnight Treasury yields and overnight Fed Funds rates, it is fair to say that when the Fed changes Fed Funds rates it is effectively quite directly changing "i" as well.
For many investments, the risk-free rate is the starting point, and premiums are added on top of that. It can be a term premium (tp), such as adding 1% for a longer term bond if the Fed forces zero percent short term interest rates (y = [1 + i + tp]^n).
For most investments a market risk premium (mp) is added as well, and this can apply to corporate bonds - but it also applies to stocks and real estate. Investors demand a risk premium for stocks and real estate, that is added on top of the risk-free rate (y = [1+ i + tp + mp]^n). Change the underlying input of the risk-free rate, and all else being equal, the outputs of stock and real estate returns and prices change as well.
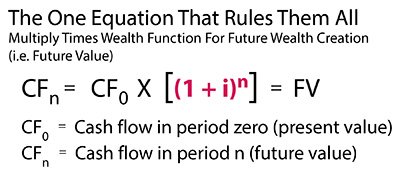
When we take our compound interest function and we put it in financial equation form then what we get is the future value of our cash flow. We take our starting cash flow, we multiply it by the compound interest function of one plus "i" raised to the N, and we find out how much cash we get from our investment in the future.
What the Federal Reserve has been doing since the crisis of 2008 is an unprecedented experiment in changing in the value of the risk free rate. By forcing a change in the value of the independent variable (the input) into an unprecedented range for long periods of time, the Fed is directly intervening and necessarily moving the value of the dependent variable (the output) - that of the creation of wealth through reinvesting cash flows over time - into an unprecedented range as well. And it is necessarily doing so in an exponential fashion, particularly at higher values of N, meaning for longer investment periods.
Keep in mind that the whole purpose of long-term investing is to reach the place where our money is working for us - rather than our working for our money.
For the period from 1962 to 2007, as can be seen by the height of the red bars, this worked on average and it worked exceedingly well. The average person could just save, not take any credit risk, and seven initial dollars in earnings on a $100 investment would become $97 in total earnings over 10 years, $287 in total earnings over 20 years, and $661 in cumulative earnings over 30 years.
Our current circumstances are (approximately) the purple bars. In recent years, the Fed has increased interest rates from the zero percent lows - but they are still nowhere close to historic averages. So a risk-averse investor would lose 65 percent of their interest earnings over 10 years, and 72 percent of their cumulative and compounded interest earnings in 20 years.
Over 30 years, a 7% investment rate will produce $661 in total earnings and a 3% investment rate will produce $143 in total earnings.
The Federal Reserve has gone down the path of trying to contain crisis and stimulate growth by manipulating the independent variable "i" in our compound interest function, and forcing the input down from seven percent to three percent.
When we look at the dependent variable - the creation of wealth from cash flows, or how much our money works for us on a cumulative basis - the output necessarily falls from $661 to $143. This $518 reduction is a 78% reduction in the creation of wealth.
Because this occurs at the level of the very foundation that underlies all of finance and investing, the ramifications of this change spread out (in filtered form) into wealth creation for all investors, in all investment categories, over the long term.
It also need to be noted this 3% level could be the peak in the current Fed cycle of increasing rates. The Fed intends to respond to future recessions by slamming short term rates right back down to (at least) zero percent, and to use quantitative easing and trillions in new money to reduce term premiums, and directly force medium and long term bond yields down as well.
The Fed intends to pursue policies where the gold bars will be back on a more frequent basis, and where each episode may potentially occur on a more protracted basis. A risk averse investor would lose 90 percent of their interest earnings over 10 years and 93 percent of their interest earnings over 20 years.
In the event of future recessions, the Federal Reserve intends to go down a path of trying to contain crisis and stimulate growth by manipulating the independent variable in our compound interest function of "i", forcing the input down from the historical seven percent average to a mere one percent (in round number terms, with the assumptions in this illustration).
When we look at the dependent variable of the creation of wealth from cash flows, or how much our money works for us on a cumulative basis, this as a matter of mathematical necessity forces a reduction in the output of the creation of wealth from $661 down to a miniscule $35. This $626 loss in earnings is a 95 percent reduction in the dependent variable of the creation of wealth.
Because this change in the dependent variable exists at the very foundation that underlies all investing, the ramifications would spread out (in filtered form) to wealth creation for all investors, in all investment categories - including stocks and real estate - over the long-term.
The Federal Reserve fully intends - if needed - to contain crisis by using a policy of forcing the independent variable of the risk-free rate into what had been an unprecedented range for what could be many years or the better part of decades to come. If this happens, it will in fact quite directly force the exponential reduction of the dependent variable of the creation of wealth from cash flows over time, with wealth creation falling to only five percent or less of historic norms at sufficiently high values of N.
(As someone who has written about inflation-adjusted returns for many years, the next question becomes one of real returns. This series is a step by step process, and taking on too much at any single stage greatly reduces understanding, so I won't go there just yet. As a quick summary, however, comparing the compounding of real (inflation-adjusted) returns between historical averages and recent averages produces results that are far worse than the nominal results shown herein, as explored in the analysis linked here.)
Matrix Positioning
The graphic below is an organizational framework I created, to help explain how the changes in the cycles of crisis and the containment of crisis can change investment category results at various stages in those cycles.
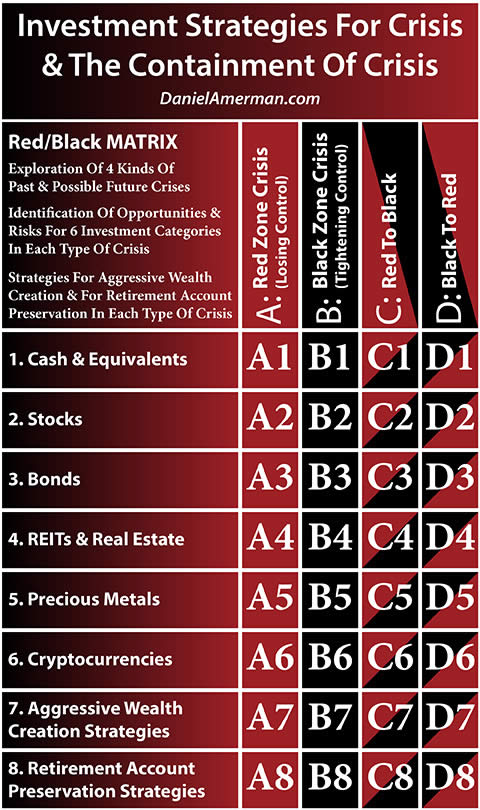
An explanatory analysis for the matrix is linked here.
This analysis falls in the B3 cell, which the intersection of the Black B column for a cycle of the containment of crisis, and the 3rd row, which is the investment category of bonds. While not specifically developed herein, there are also very strong implications for the B2 & B4 matrix cells, which are stock and real estate performance when the Fed is using its planned policy tools to respond to recession and the threat of crisis.
It should also be noted that the word "matrix' is used herein not in the strict mathematical sense, but in one of the alternative usages, which is a table where there is a mathematical relationship between the columns and rows that helps to determine the individual cell contents.
There are many factors which drive the columns, and two critical ones are the Fed changing the independent variable of the risk free rate - and the independent variable of the term premium (via QE) - in the different columns, which represent the different stages of the cycles of crisis and the containment of crisis. When it does that, the Fed mathematically changes the dependent variables including prices and the creation of wealth from cash flows, in each of the investment categories that are the rows.
Because these are exponential functions, this means that the impact of the cyclical changes in the columns can lead to truly radical changes in the dependent variables of 1) price, 2) risk and 3) cash flow driven wealth creation in the investment rows, indeed, changes that are so large as to be non-intuitive for most investors.
To have an extremely powerful agency making non-random changes in the very mechanics of wealth creation, and to in doing so destroy up to 95% of the historically most reliable way of building wealth over time - is deeply troubling.
On the other hand, the world is what it is at this time. And as the Fed travels down this unprecedented path of potentially repeated iterations of zero percent interest rates and QE stacking, the implications of having a framework for understanding how future unconventional policy changes in the independent variables could potentially lead to exponential changes in the dependent variables of future stock, bond, real estate and precious metals returns, with the ability to then target the most attractive opportunities as they move between the rows and the cells in a logical and mathematical process with the progression of the cycles - now, that is fascinating to think about.
Daniel R. Amerman, CFA
Website: http://danielamerman.com/
E-mail: mail@the-great-retirement-experiment.com
Daniel R. Amerman, Chartered Financial Analyst with MBA and BSBA degrees in finance, is a former investment banker who developed sophisticated new financial products for institutional investors (in the 1980s), and was the author of McGraw-Hill's lead reference book on mortgage derivatives in the mid-1990s. An outspoken critic of the conventional wisdom about long-term investing and retirement planning, Mr. Amerman has spent more than a decade creating a radically different set of individual investor solutions designed to prosper in an environment of economic turmoil, broken government promises, repressive government taxation and collapsing conventional retirement portfolios
© 2019 Copyright Dan Amerman - All Rights Reserved
Disclaimer: This article contains the ideas and opinions of the author. It is a conceptual exploration of financial and general economic principles. As with any financial discussion of the future, there cannot be any absolute certainty. What this article does not contain is specific investment, legal, tax or any other form of professional advice. If specific advice is needed, it should be sought from an appropriate professional. Any liability, responsibility or warranty for the results of the application of principles contained in the article, website, readings, videos, DVDs, books and related materials, either directly or indirectly, are expressly disclaimed by the author.
© 2005-2022 http://www.MarketOracle.co.uk - The Market Oracle is a FREE Daily Financial Markets Analysis & Forecasting online publication.