


Are Investors Blind To The Stocks Upside Super Cycle?
Stock-Markets / Stock Markets 2019 Mar 27, 2019 - 07:37 PM GMTBy: Chris_Vermeulen

 Our research team believes the upside pricing potential of the US market could be under-estimated by global traders and investors. We’ve been pouring over the charts and data trying to substantiate our hypothesis with our proprietary price modeling systems and technical analysis systems for the past few days. Our results suggest the US stock market, in comparison to the global markets, could still be under-priced at current levels based on investor sentiment and this could be just the beginning of a super cycle rally we have seen happen one before.
Last year during the price rotation in February 2018, we hypothesized the current rotation was not the end of a 5-Wave Elliot Wave formation. We believe the January 2018 highs are potentially the end of Wave 3 which is part of a much larger Wave A upside price swing. Our research suggested that the retracements in 2010 and 2011 were not sufficient to qualify as any type of traditional Elliot Wave structure, thus the retracement in 2015 qualified as a Wave B formation. This presented an upside Wave A size of +366%, or +$89.66, on the QQQ chart. The Wave C move, from the lows of 2015 to the highs of 2018, presented an upside Wave C size of +121%, or +$102.77. Given these Wave A and C sizes, we believe the upside potential of a final Wave E (the last wave higher) in the US stock market could be at least 100% to 161% the size of the last Wave C formation.
This presents a very interesting possibility that our most recent article about the Treasury Yield Inversion and the concerns about a pending recession may be setting the wrong tone for traders. Yes, the 2020 Presidential election cycles typically result in some price rotation and sideways trading for US stocks. This may hold true over the next 16+ months before the elections and there may not be much we can do about it other than trade these price rotations. After the elections, though, we believe the upside price potential for the US stock market could be incredibly under-estimated. How under-estimated, you ask? The upside potential could be as large as +20% to 25% or more.
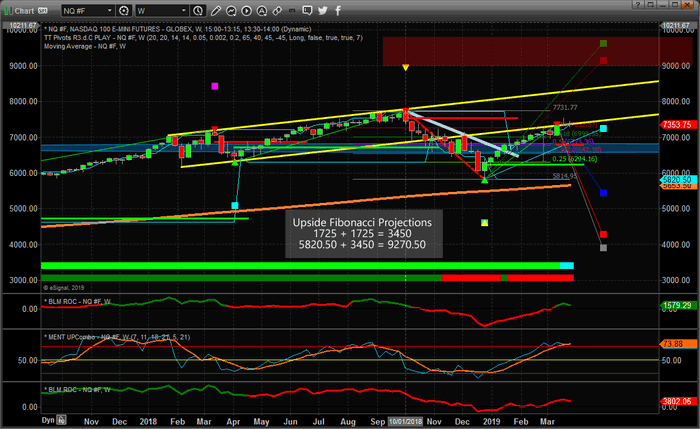
The red box on this Weekly NQ (NASDAQ) chart highlights the Fibonacci and Elliot Wave target levels when we presume a 100% upside price leg. Please remember the upside leg could be as large as 161%, 200% or more on this final Wave E (or Wave 5). The projected upside target levels on the NQ are near 9250 (or higher).
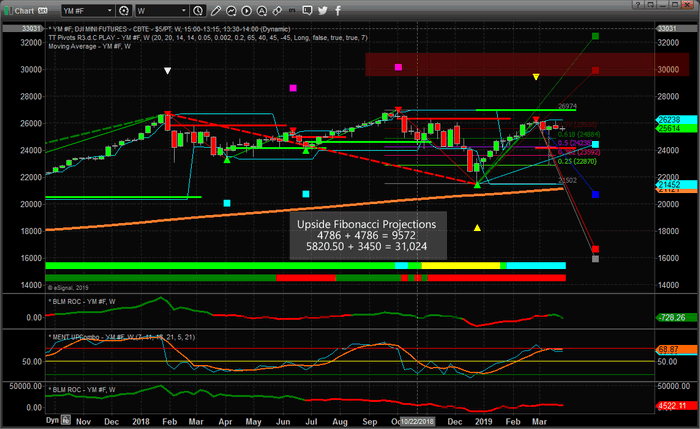
The same types of price projection points (or targets) using the Fibonacci and Elliot Wave theories predict a similar upside target level on this Weekly YM (DOW JONES) chart. Current price rotation suggests an upside target near $31,000 for the YM (or higher) before this upside move completes.
Remember, the US Presidential election cycles typically mute price rotation a bit and present a bit of sideways trading. We’ve highlighted our expectations on the following Custom Market Cap Chart we follow that helps us determine where price levels are in relation to historical norms. You can see from this chart that we are currently sitting right at the historical middle pricing level going back almost 8 years. We would expect a moderate upside pricing bias to continue as we head into the US election cycle with mild price rotation. After the election cycle is complete, which is highlighted on this chart, we assume market price capitalization would be below historically normal levels and poised for an upside move (assuming a new US President is not elected with plans/policies to disrupt current GDP and economic growth factors).
Typically, Wave E (or Wave 5) formations can be relatively short in structure, or at least as long as Wave A or Wave C. It is most common for Wave E formations to at least be as long as Wave C and in many cases, Wave E can extend well beyond Wave C length.
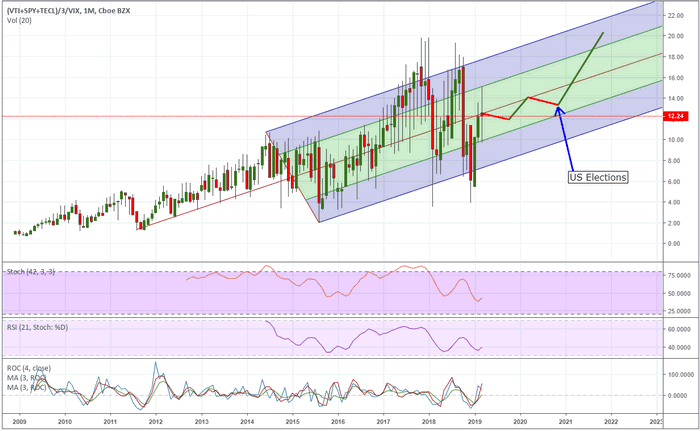
Custom Index – Custom Index chart by TradingView
We believe the next 16+ months will test the abilities and skills of truly skilled traders. We believe price rotation and sector rotation will be key to finding and executing proper trades. All the while, remember that a biased upside price trend will likely continue. As we get into the final 4~5 month’s price to the US elections, be prepared to identify and set up some exceptional trading opportunities. If our research is correct, this last move higher will begin somewhere near January 2021 and the upside move could last until our cycle peak date of 2027 which may sound crazy, but I will share you with a super cycle higher that could happen, and we have seen this before. Stay tuned for the Part II of this Special Report
Find out how our research and trading team can assist you in finding and executing better trades throughout all of these moves. We are about to launch our newest technology solution for our members at www.TheTechnicalTraders.com and we believe we provide some of the best research, daily video analysis and trading triggers you can find anywhere on the planet. We like to keep things simple and manageable for our members. We issue 2~3 trades a week (max) and we target 5~25% swings in ETF and stocks. We also provide incredible insight into the markets which allows you, the skilled trader, to make your own trading decisions while being better informed and understanding current market dynamics.
Chris Vermeulen
www.TheTechnicalTraders.com
Chris Vermeulen has been involved in the markets since 1997 and is the founder of Technical Traders Ltd. He is an internationally recognized technical analyst, trader, and is the author of the book: 7 Steps to Win With Logic
Through years of research, trading and helping individual traders around the world. He learned that many traders have great trading ideas, but they lack one thing, they struggle to execute trades in a systematic way for consistent results. Chris helps educate traders with a three-hour video course that can change your trading results for the better.
His mission is to help his clients boost their trading performance while reducing market exposure and portfolio volatility.
He is a regular speaker on HoweStreet.com, and the FinancialSurvivorNetwork radio shows. Chris was also featured on the cover of AmalgaTrader Magazine, and contributes articles to several leading financial hubs like MarketOracle.co.uk
Disclaimer: Nothing in this report should be construed as a solicitation to buy or sell any securities mentioned. Technical Traders Ltd., its owners and the author of this report are not registered broker-dealers or financial advisors. Before investing in any securities, you should consult with your financial advisor and a registered broker-dealer. Never make an investment based solely on what you read in an online or printed report, including this report, especially if the investment involves a small, thinly-traded company that isn’t well known. Technical Traders Ltd. and the author of this report has been paid by Cardiff Energy Corp. In addition, the author owns shares of Cardiff Energy Corp. and would also benefit from volume and price appreciation of its stock. The information provided here within should not be construed as a financial analysis but rather as an advertisement. The author’s views and opinions regarding the companies featured in reports are his own views and are based on information that he has researched independently and has received, which the author assumes to be reliable. Technical Traders Ltd. and the author of this report do not guarantee the accuracy, completeness, or usefulness of any content of this report, nor its fitness for any particular purpose. Lastly, the author does not guarantee that any of the companies mentioned in the reports will perform as expected, and any comparisons made to other companies may not be valid or come into effect.
Chris Vermeulen Archive |
© 2005-2022 http://www.MarketOracle.co.uk - The Market Oracle is a FREE Daily Financial Markets Analysis & Forecasting online publication.