


Will the Stock Market Crash Like 1937?
Stock-Markets / Stock Markets 2019 Mar 19, 2019 - 04:14 PM GMTBy: Troy_Bombardia

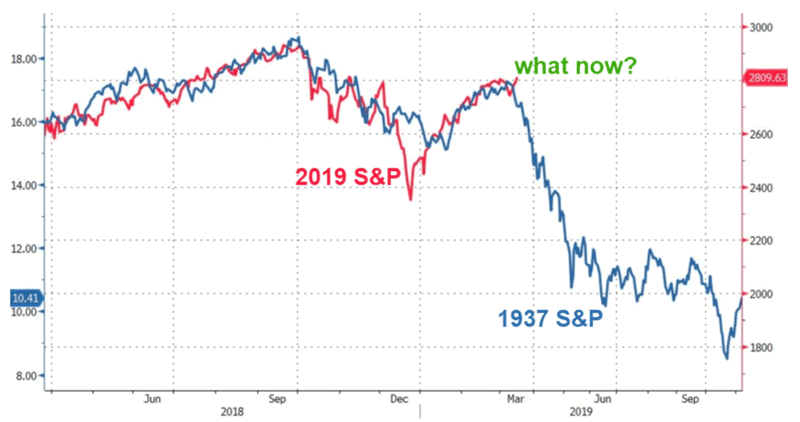
As the stock market rallies, it never ceases to amaze me how popular crash-analogues can be. The 1937 analogue has been quite popular recently, constantly shared and reshared on social media and trading blogs.
Go here to understand our fundamentals-driven long term outlook.
Let’s determine the stock market’s most probable medium term direction by objectively quantifying technical analysis. For reference, here’s the random probability of the U.S. stock market going up on any given day.

*Probability ≠ certainty. Past performance ≠ future performance. But if you don’t use the past as a guide, you are blindly “guessing” the future.
Consumer Discretionary vs defensive
Consumer discretionary stocks have underperformed defensive stocks recently, which for experienced traders brings back memories of 2000 and 2007.
We recently looked at the XLY:XLP ratio.
Here’s another way to look at the gap between discretionary and defensives.
This is the XLY:XLU ratio vs. the S&P 500
- XLY = consumer discretionary ETF
- XLU = utilities ETF
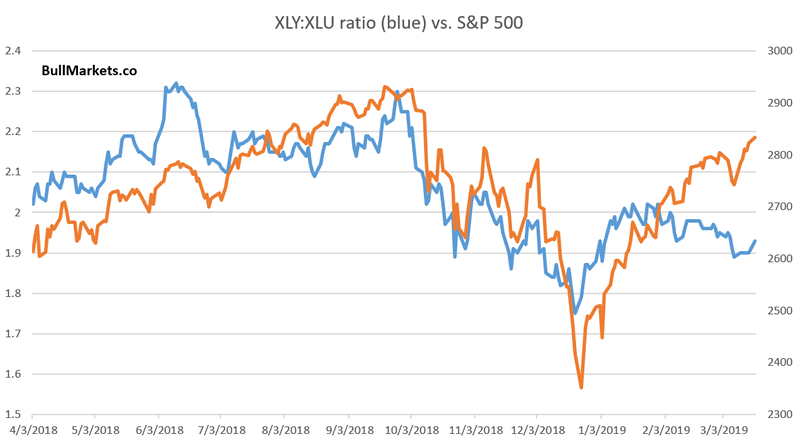
As you can see, the S&P 500 has “diverged” from the XLY:XLU ratio. Surely this can’t be good for stocks?
*I have warned in the past against excess focus on “divergences” and “non-confirmation”. Most of these divergences don’t amount to anything.
Here’s what happens next to the S&P when XLY:XLU falls over the past 2 months while the S&P rallies more than 9%.
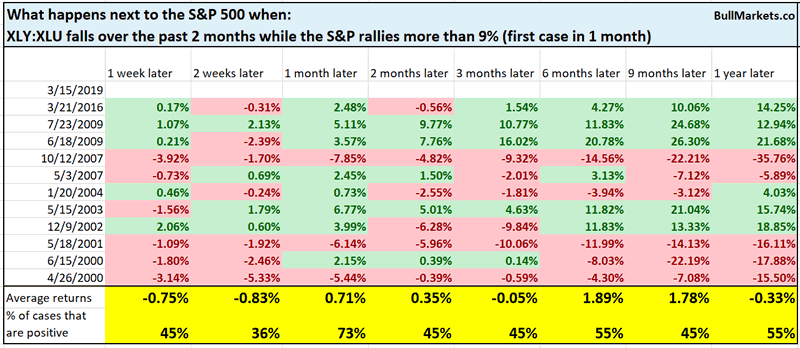
As you can see, forward returns are more bearish than random. This mostly happens around bear markets, either at the top or at the bottom. There are also some false bearish signs e.g. in 2016, 2004, 2003.
It’s also worth looking at the components in XLY before jumping to any conclusions.
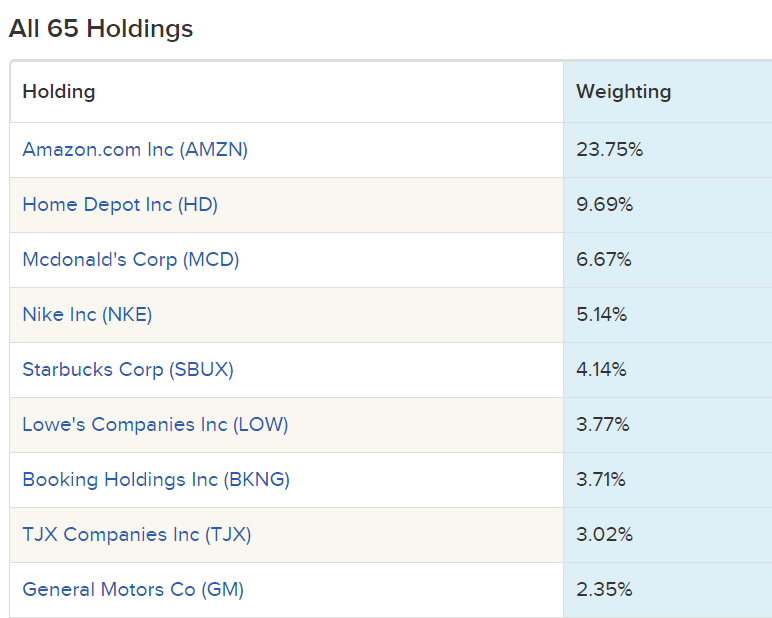
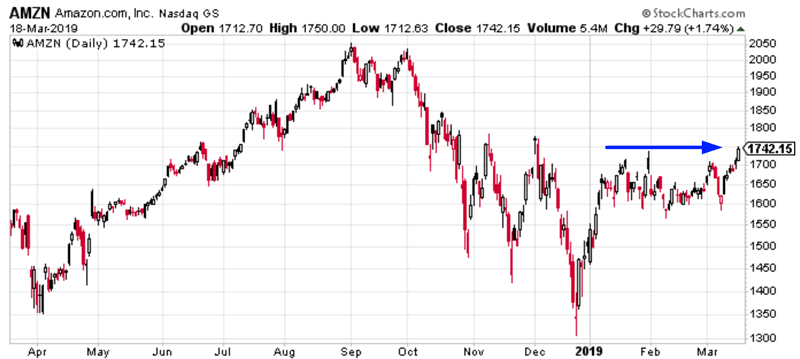
As you can see, Amazon accounts for almost 1/4 of XLY
Amazon has performed poorly recently.
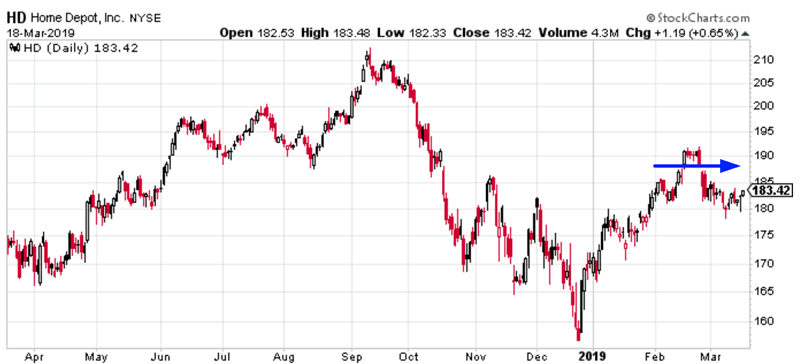
Here’s Home Depot
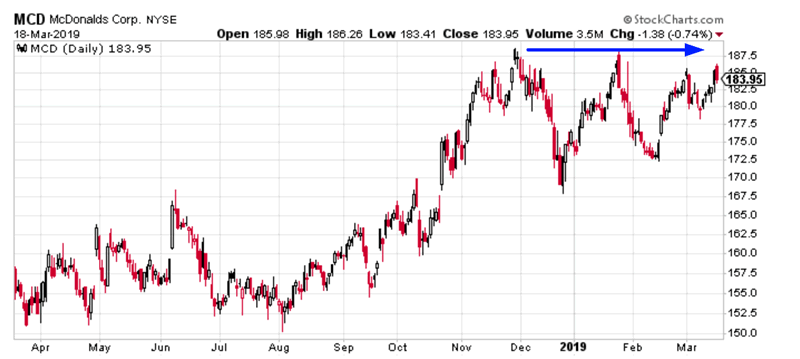
Here’s McDonalds
Debt
One of the most oft-cited long term bearish arguments is “debt is rising, must be bad for the economy and stock market”.
*In reality, nominal debt always rises in the long run. What matters is the ability of borrowers to service their debt. This takes into account rising income vs. rising debt levels vs. interest rates.
The following chart looks at the yearly % change in Personal Interest Payments. Notice how it is high right now.
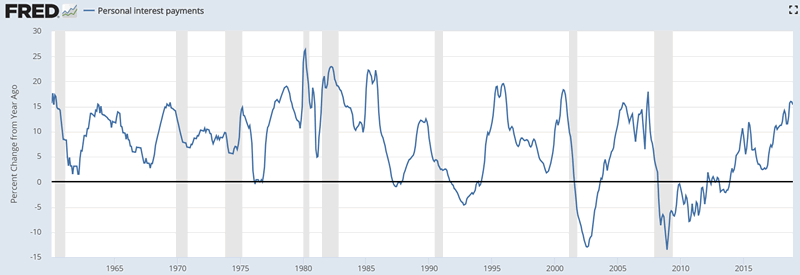
Here’s what happens next to the S&P when the yearly % change in Personal Interest Payments exceeds 15% for 4 consecutive months.
*The most recent data is for the month of December 2018, but was released in March 2019 due to the government shutdown.
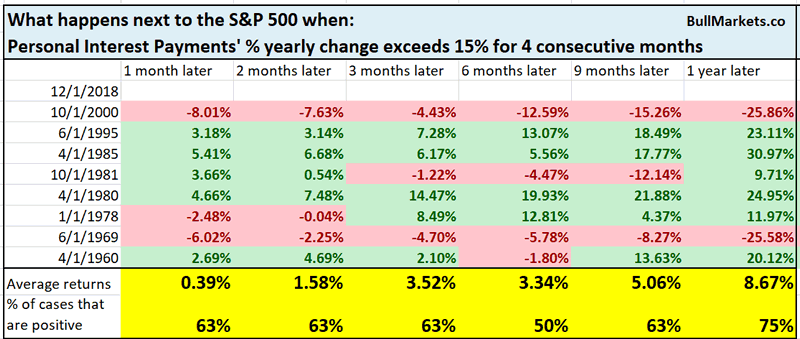
Not quite consistently bearish for stocks, but this does happen late-cycle in the economic expansion.
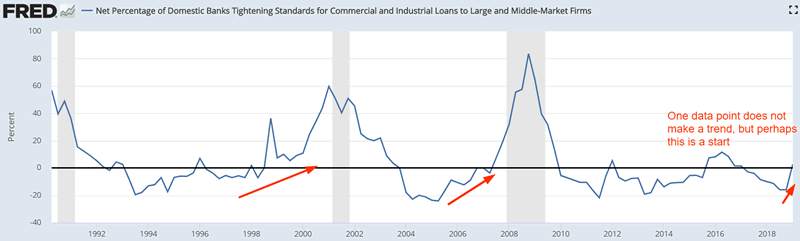
Banks’ lending standards
Banks’ lending standards could be on the verge of trending up, which is a problem later in 2019. In the past, lending standards trended higher before bear markets and recessions began.
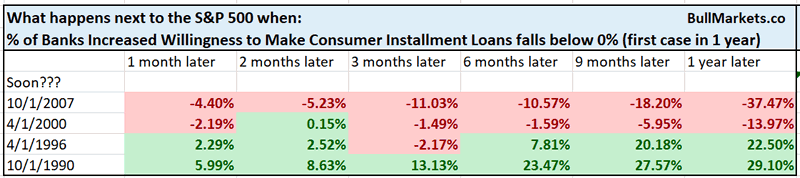
A mirror image of Banks’ Lending Standards is the % of banks that have increased their willingness to make consumer installment loans. The latest reading for this figure came close to zero.

If this figure reaches zero later in 2019, then long term bulls should watch out. It happens at the start of major bear markets and recessions with the 1996 case being a false alarm.
Bollinger Band
The S&P 500 closed above its upper Bollinger Band today for the first time in almost 6 months (2 standard deviation, 20 daily). Surely this must be bearish?
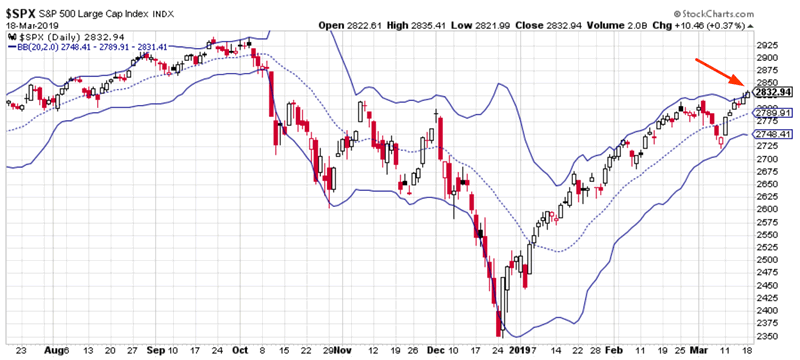
Here’s what happens next to the S&P 500 when it closes above its upper Bollinger Band for the first time in 5 months.
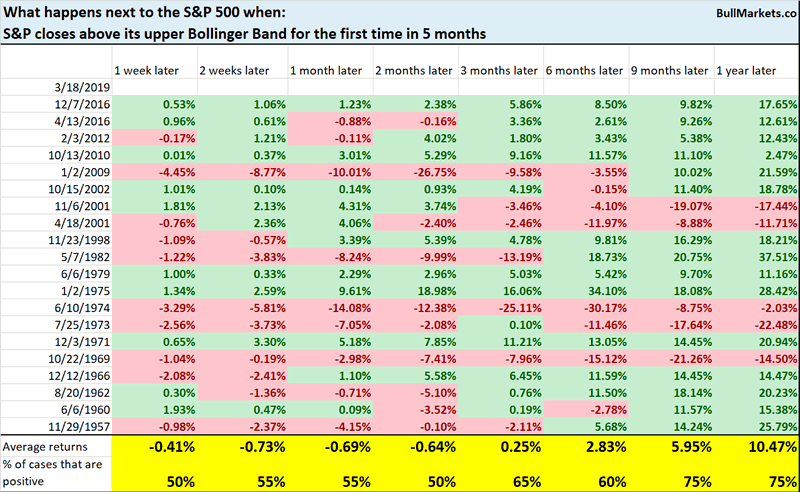
As you can see, the stock market’s forward returns are mostly random. Most popular technical indicators are not much better than a coin toss.
*In trading as in life, what’s popular isn’t often what’s best. Things that are popular are usually best at shouting the loudest and being popular – they’re not the best at what they’re supposed to do. #ThePowerOfMarketing
Great Depression?
This has been a very dramatic turnaround, with the S&P falling more than -13% in Q4 2018 and rallying more than 13% in Q1 2019.
If the S&P doesn’t fall signficantly throughout the rest of March, then this turnaround will truly be one for the history books.
Here’s what happens next to the S&P when it falls more than -13% in one quarter and then rallies 13%+ in the next quarter.
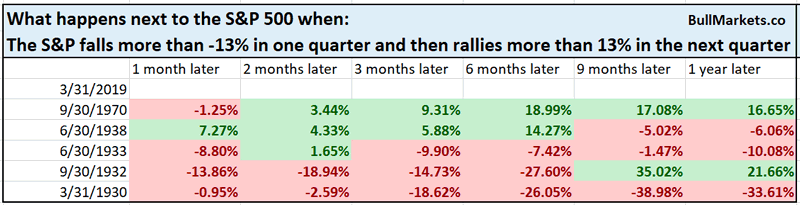
As you can see, such volatility only happened in bear markets and the Great Depression.
Does this mean that 2019 = the Great Depression all over again?
No.
The economy is growing today. Very different macro environment from the historical cases.
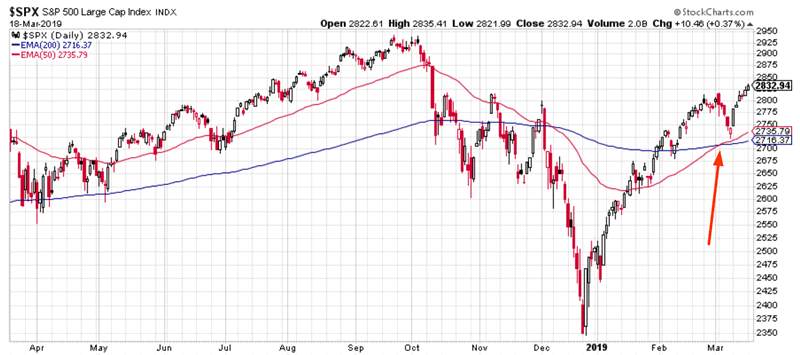
Crossover
The S&P 500’s 50 ema crossed above its 200 ema recently. These moving average crossovers are used in popular trend following strategies.
- Buy when the faster moving average crosses above the slower moving average (e.g. 50 ema crosses above 200 ema)
- Sell when the faster moving average crosses below the slower moving average (e.g. 50 ema crosses below the 200 ema)
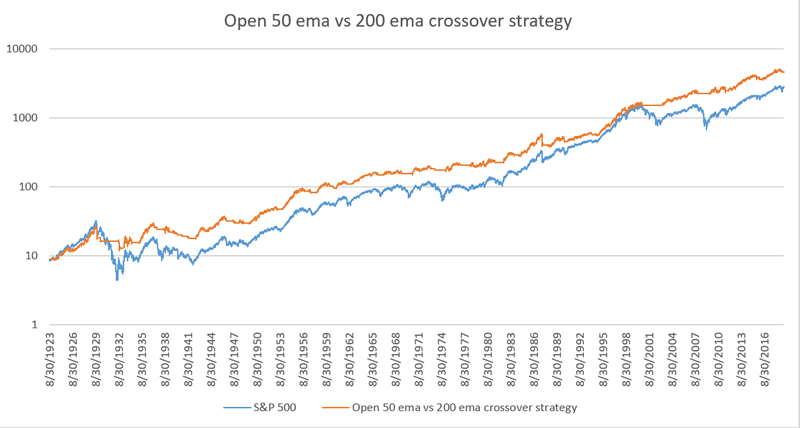
The beauty behind technical trend following strategies is that they are very easy to backtest. Here’s the same strategy, backtested from 1923-present
- When today’s 50 ema (CLOSE $) crosses above today’s 200 ema, BUY the S&P 500 on the next day’s CLOSE.
- When today’s 50 ema (CLOSE $) crosses below today’s 200 ema, SELL the S&P 500 on the next day’s CLOSE.
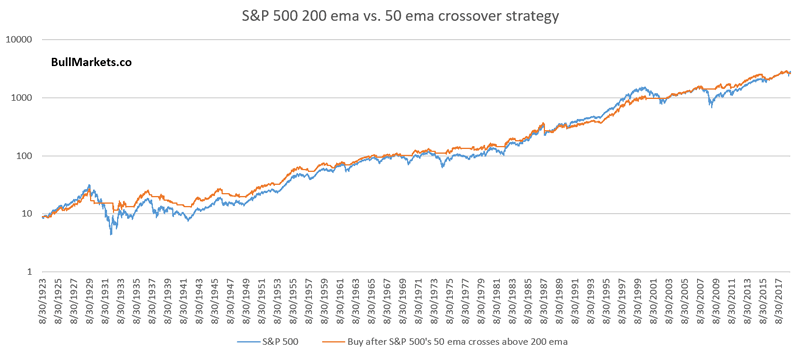
As you can see, this strategy almost completely matches buy and hold, but with much less downside volatility.
In talking with Puru, he used the same strategy but came out with slightly better returns than I did:
- Buy and hold yields an average of 5.9%
- This strategy yields an average of 6.43%
What’s going on with this discrepancy? Why is the same moving average crossover strategy yielding 2 different results?
- My backtest: when the moving averages crossover today, I buy/sell on the next day’s CLOSE
- Puru’s backtest: when the moving averages crossover today, he buy/sells on the next day’s OPEN.
I have attached the data in Excel for those who want to play around with this very simple trend following strategy/model.
Crash analogues aren’t very useful
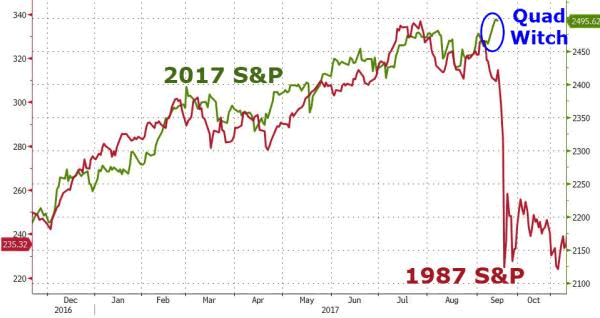
Yes, it “looks” scary because the stock market today “looks” like 1937
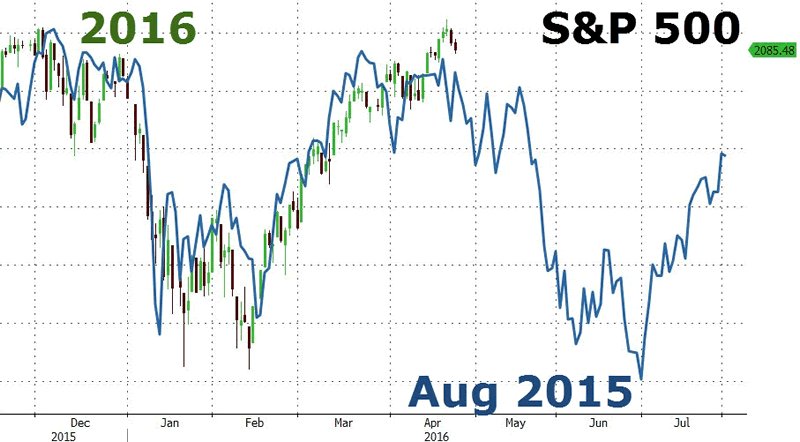
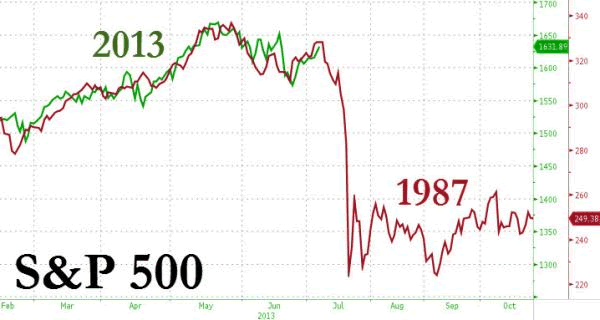
In reality, these analogues aren’t very useful. When you squeeze, compress, stretch, and change the scales, you can always make the S&P 500 “look like” it’s doing whatever fits your preconceived bias.
This was a “stocks will crash” analogue in 2017
Another one in 2016
And another one in 2013
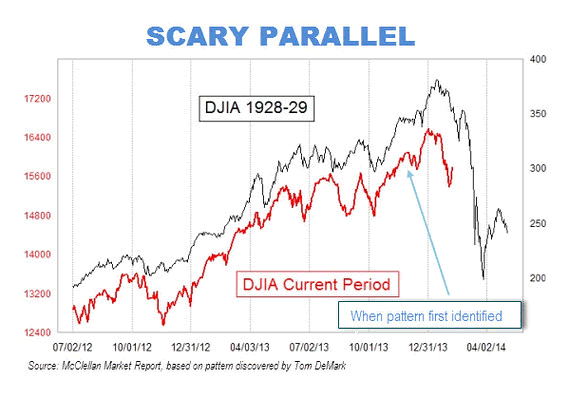
And another in 2012
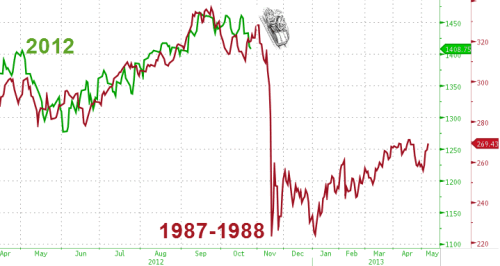
Yes, the stock market today is “eerily” similar to 1937. But it’s also “eerily” similar to 2015, 2014, 2013, 2012, 2011, 2010, 2009, 2008, 2007…
Fractals & analogues = optical illusions
Click here for yesterday’s market analysis
Conclusion
Here is our discretionary market outlook:
- The U.S. stock market’s long term risk:reward is no longer bullish. In a most optimistic scenario, the bull market probably has 1 year left. Long term risk:reward is more important than trying to predict exact tops and bottoms.
- The medium term direction (e.g. next 6-9 months) is more bullish than bearish.
- The stock market’s short term has a bearish lean due to the large probability of a pullback/retest. Focus on the medium-long term (and especially the long term) because the short term is extremely hard to predict.
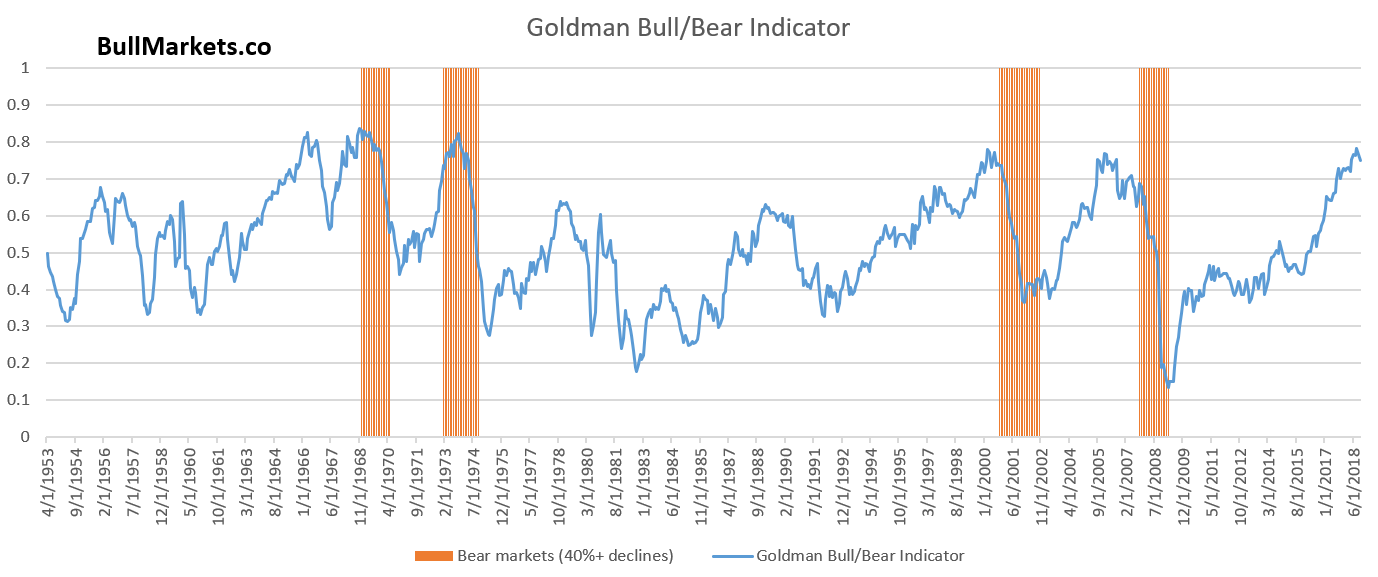
Goldman Sachs’ Bull/Bear Indicator demonstrates that while the bull market’s top isn’t necessarily in, risk:reward does favor long term bears.
Our discretionary outlook is not a reflection of how we’re trading the markets right now. We trade based on our quantitative trading models.
Members can see exactly how we’re trading the U.S. stock market right now based on our trading models.
Click here for more market studies
By Troy Bombardia
I’m Troy Bombardia, the author behind BullMarkets.co. I used to run a hedge fund, but closed it due to a major health scare. I am now enjoying life and simply investing/trading my own account. I focus on long term performance and ignore short term performance.
Copyright 2019 © Troy Bombardia - All Rights Reserved
Disclaimer: The above is a matter of opinion provided for general information purposes only and is not intended as investment advice. Information and analysis above are derived from sources and utilising methods believed to be reliable, but we cannot accept responsibility for any losses you may incur as a result of this analysis. Individuals should consult with their personal financial advisors.
© 2005-2022 http://www.MarketOracle.co.uk - The Market Oracle is a FREE Daily Financial Markets Analysis & Forecasting online publication.