


Towards the End of a Stocks Bull Market, Short term Timing Becomes Difficult
Stock-Markets / Stock Markets 2019 Mar 16, 2019 - 03:33 PM GMTBy: Troy_Bombardia

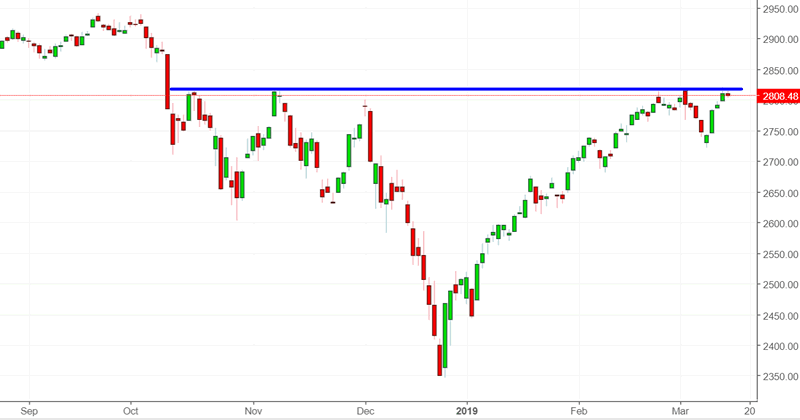
The S&P remains stuck at its 2810 resistance level. Meanwhile, various economic indicators are flashing warning signs but not immediately bearish signs. Towards the end of a bull market, it’s very hard to know exactly how much gas there is left in the bull market’s tank. That’s why it’s better to focus on risk-reward instead of timing exact tops and bottoms.
Go here to understand our fundamentals-driven long term outlook.
Let’s determine the stock market’s most probable medium term direction by objectively quantifying technical analysis. For reference, here’s the random probability of the U.S. stock market going up on any given day.

*Probability ≠ certainty. Past performance ≠ future performance. But if you don’t use the past as a guide, you are blindly “guessing” the future.
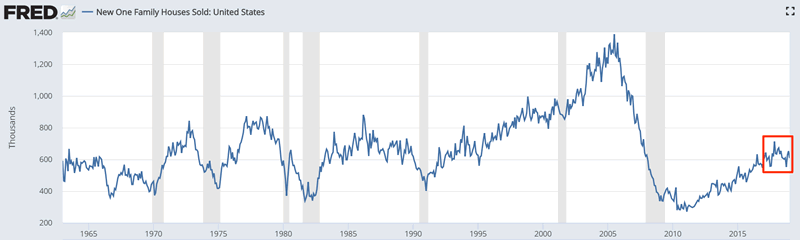
New Home Sales
As expected, the housing market remains mediocre. The latest reading for New Home Sales fell from its previous reading, but more importantly, New Home Sales’ 12 month moving average has fallen more than -2.4% in the past 5 months. Focus on the data’s trend instead of month-to-month readings.
Here’s what happens next to the S&P when New Home Sales’ 12 month moving average falls more than -2.4% over the past 5 months.

As you can see, this happens near some bull market tops.
- March 2006: 1.5 years before the bull market top
- June 1989: 1 year before a recession began
- April 1987: 3 months before a -30% stock market crash began
- April 1979: 1 year before a recession began
- September 1968: the start of a bear market.
Not immediately bearish for stocks, but something to watch out for in case the weakness in housing persists.
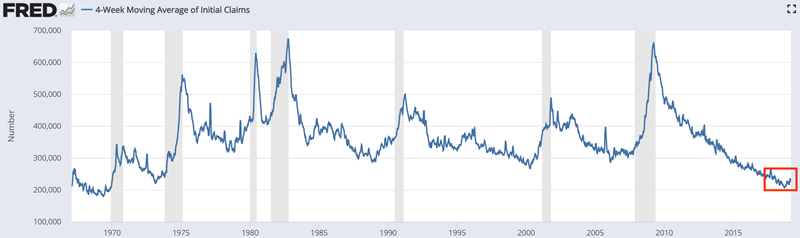
Labor market
The 4 week moving average of Initial Claims is trending higher. This is noticeably different from the rest of this economic expansion, in which Initial Claims was continuously falling.
To calculate the trend in Initial Claims, we can look at the 4 week average’s 6 month rate-of-change.
This rate-of-change has risen for 10 consecutive weeks, while Unemployment is under 5% (i.e. late-cycle cases).
Historically, this is not a good combination for stocks, especially 6+ months later.
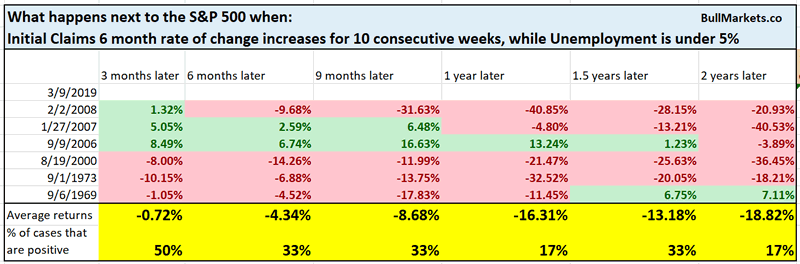
Every historical case occurred when a bear market had already began, with the exception of September 2006. For the September 2006 case, the bear market began 1 year later. That in my mind is the most optimistic case. Either way, think risk-reward. Even if the stock market keeps going up throughout 2019 (which is what price action suggests), would you want to be long, knowing that all the long term risk is to the downside?
First sign since 2009?
The S&P significantly outperformed the Dow this Monday and Tuesday. This is partially because Boeing stock cratered. (The Dow’s problem is that since it only consists of 30 stocks, each stock has a big impact on the index in the short term).
A recent Market Watch article said “this is the first time since 2009 in which the Dow underperformed the S&P by so much”.
I’m usually wary of phrases such as “this is the first time XYZ happened since 2008/2009”. Those phrases are usually used by people who are trying to sensationalize events in order to attract your attention. E.g. “this is the first time XYZ happened since 2008, but it also happened 40 other times before 2008” does not make for an attention-grabbing headline.
Here’s every single case from 1970-present in which the S&P outperformed the Dow by more than 0.65% over 2 consecutive days.
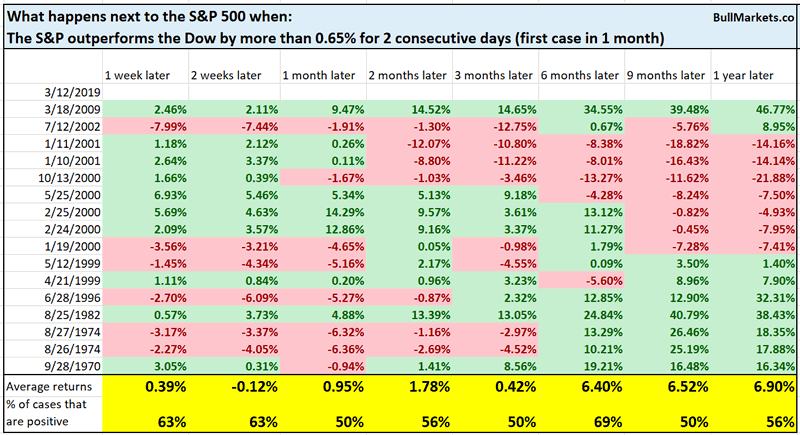
As you can see, this happens quite often near bull market tops and bear market bottoms. That’s sensical. When the S&P goes up e.g. 4% a day, it’s easy for the Dow to only go up 3%. Markets are very volatile around bear markets, which makes “significant outperformance/underperformance” easy to come by.
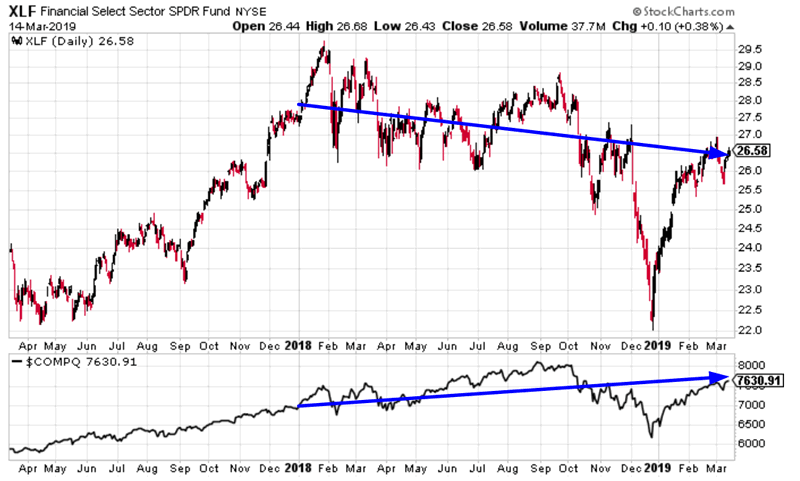
Banks (KBW vs Tech)
Since the start of January 2018, bank stocks have significantly underperformed tech stocks. This is a bit of a worry because this is how the 2000-2002 and 2007-2009 bear markets started.
- Cyclical stocks start to underperform first (e.g. bank stocks)
- High flying tech stocks outperform because every kid and their grandmother wants to make 70% a year on high-flyers like Netflix. Momentum chasing.
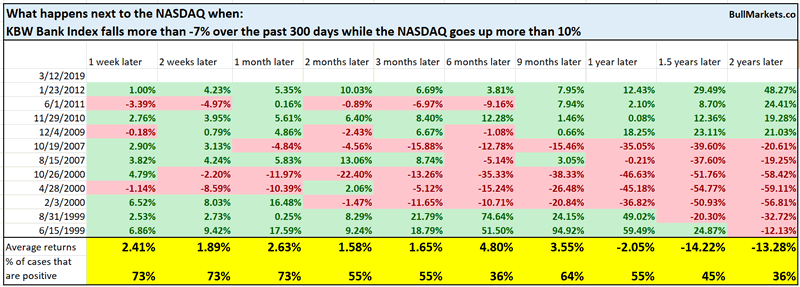
Here’s what happens next to the S&P when the KBW Bank Index falls more than -7% over the past 300 days while the NASDAQ goes up more than 10%.
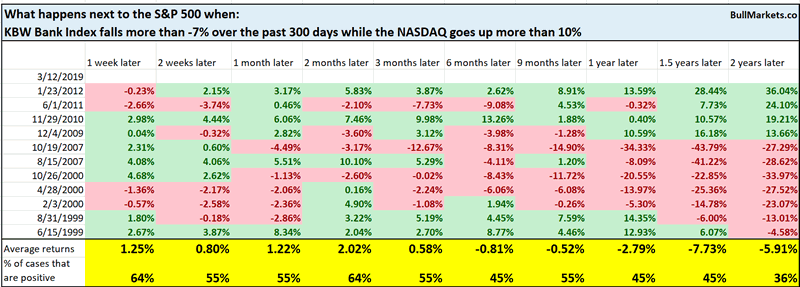
As you can see, this starts to become a problem for stocks 1-2 years later.
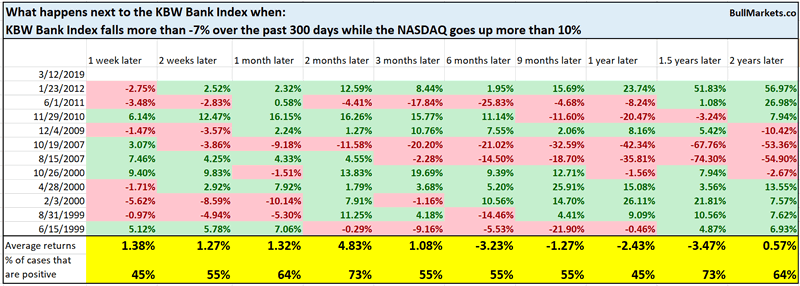
Here’s what happens next to the KBW Bank Index
Here’s what happens next to the NASDAQ
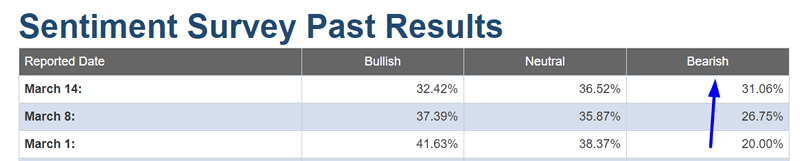
AAII
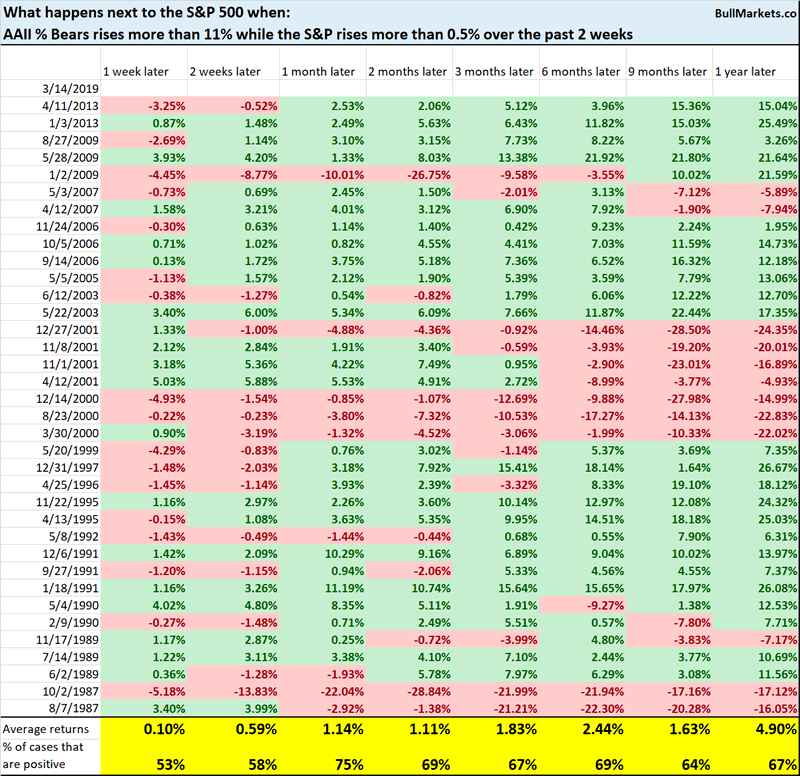
AAII% Bears has risen more than 11% over the past 2 weeks while the S&P has risen more than 0.5%
Is this “divergence” a bearish contrarian sign? Do AAII members “know something that we don’t”? (Sentiment usually moves inline with the market itself. I.e. as the market crashes, sentiment becomes bearish. As the market rises, sentiment becomes bullish).
Apparently this divergence between sentiment and price happens all the time. Neither consistently bullish nor bearish.
Click here for yesterday’s market analysis
Conclusion
Here is our discretionary market outlook:
- The U.S. stock market’s long term risk:reward is no longer bullish. In a most optimistic scenario, the bull market probably has 1 year left. Long term risk:reward is more important than trying to predict exact tops and bottoms.
- The medium term direction (e.g. next 6-9 months) is more bullish than bearish.
- The stock market’s short term has a bearish lean due to the large probability of a pullback/retest. Focus on the medium-long term (and especially the long term) because the short term is extremely hard to predict.
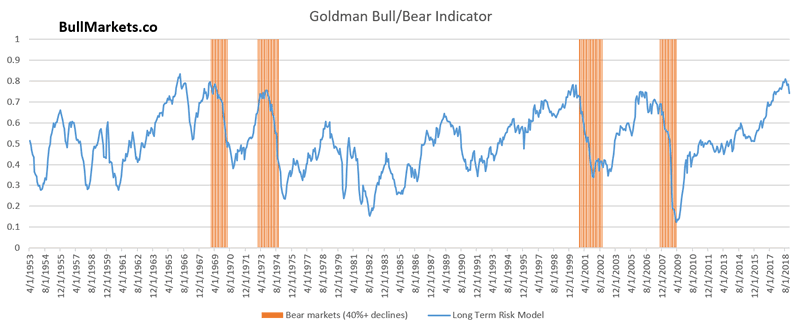
Goldman Sachs’ Bull/Bear Indicator demonstrates that while the bull market’s top isn’t necessarily in, risk:reward does favor long term bears.
Our discretionary outlook is not a reflection of how we’re trading the markets right now. We trade based on our quantitative trading models, such as the Medium-Long Term Model.
Members can see exactly how we’re trading the U.S. stock market right now based on our trading models.
Click here for more market studies
By Troy Bombardia
I’m Troy Bombardia, the author behind BullMarkets.co. I used to run a hedge fund, but closed it due to a major health scare. I am now enjoying life and simply investing/trading my own account. I focus on long term performance and ignore short term performance.
Copyright 2018 © Troy Bombardia - All Rights Reserved
Disclaimer: The above is a matter of opinion provided for general information purposes only and is not intended as investment advice. Information and analysis above are derived from sources and utilising methods believed to be reliable, but we cannot accept responsibility for any losses you may incur as a result of this analysis. Individuals should consult with their personal financial advisors.
© 2005-2022 http://www.MarketOracle.co.uk - The Market Oracle is a FREE Daily Financial Markets Analysis & Forecasting online publication.