


Stock Market’s Rally Slowing Down. Expect a Surge in Volatility?
Stock-Markets / Stock Markets 2019 Mar 06, 2019 - 06:32 AM GMTBy: Troy_Bombardia

The stock market’s nonstop rally is slowing down, with the S&P 500 below its 10 day moving average for the first time in 41 days. The short-medium term outlook is mixed right now, with neither bulls nor bears having a strong edge (although there is a slight short term bearish lean). Meanwhile, there’s a >50% probability that volatility will spike in the next few weeks.
Go here to understand our fundamentals-driven long term outlook.
Let’s determine the stock market’s most probable medium term direction by objectively quantifying technical analysis. For reference, here’s the random probability of the U.S. stock market going up on any given day.

*Probability ≠ certainty. Past performance ≠ future performance. But if you don’t use the past as a guide, you are blindly “guessing” the future.
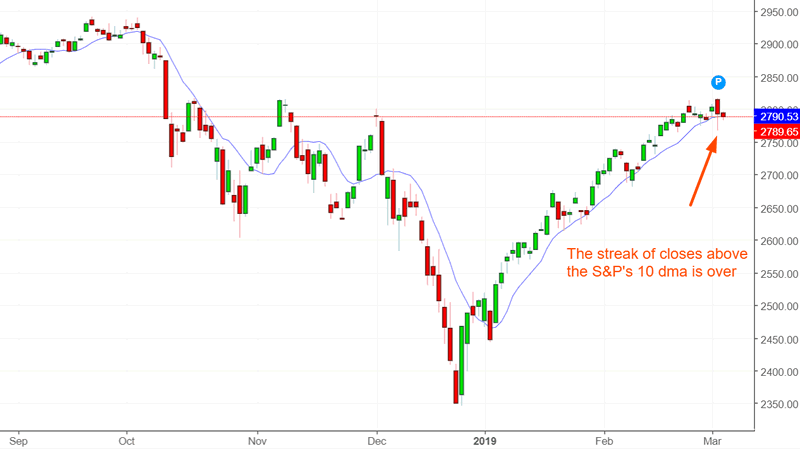
The streak ends
The S&P has closed below its 10 day moving average for the first time in 41 days. This is incredible. The 10 dma hugs the S&P very closely, which means that the S&P typically fluctuates above and below the 10 dma, even during a rally.
This nonstop rally is now over.
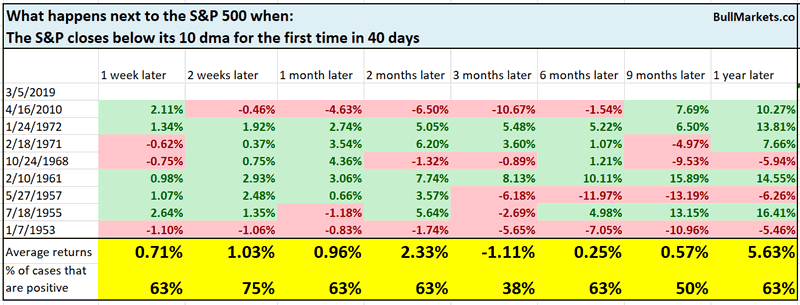
Similar historical cases saw the S&P experience a little weakness over the next 3 months.
Volatility spike?
The stock market’s volatility is very compressed right now, which is typically the setup for a spike in volatility.
Monday saw VIX’s daily high exceed its upper Bollinger Band and its daily low penetrate its lower Bollinger Band. This is only possible when VIX’s Bollinger Band is very narrow (i.e. volatility is compressed).
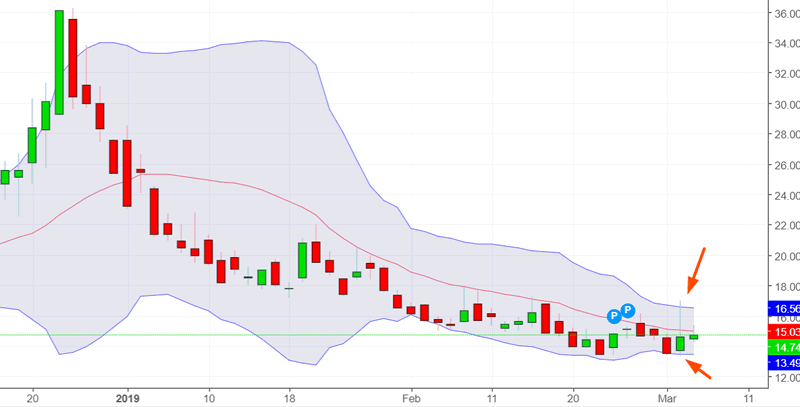
From 1990, this has only happened 1 other time: July 14, 2004
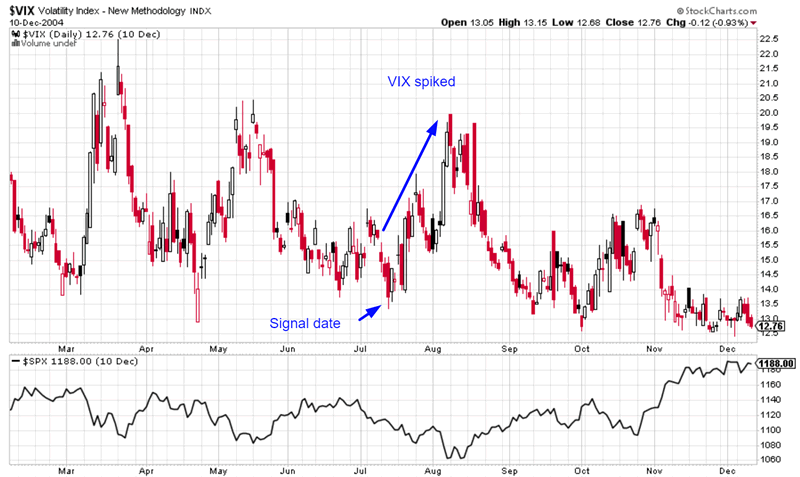
In that historical case, the S&P experienced short term weakness over the next month while VIX spiked.
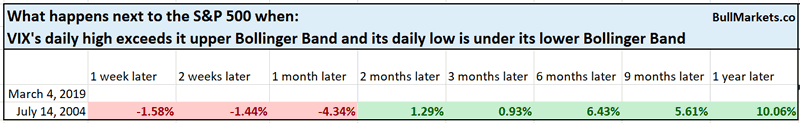
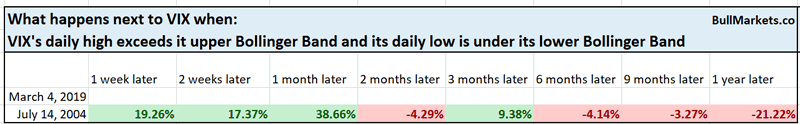
*N=1, so take this with a grain of salt
Another way of looking at VIX
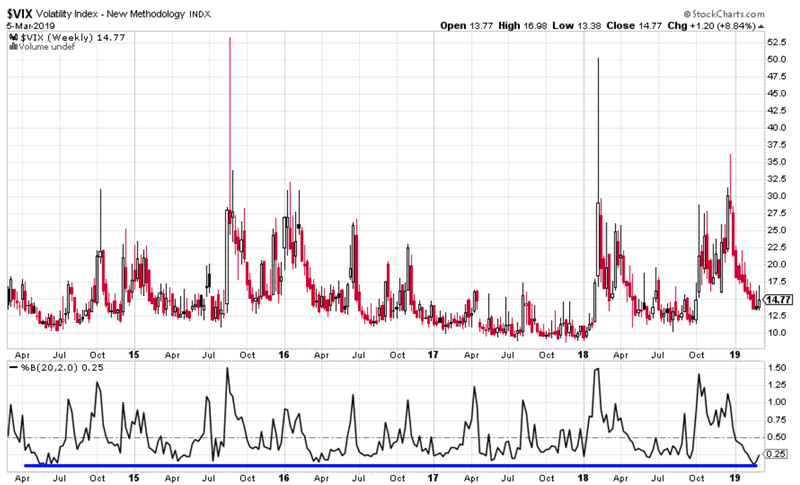
For a different way of looking at VIX, we can use the %B Indicator. %B quantifies a market’s price relative to the upper and lower Bollinger Band.
- If %B is low, then the market is in the lower end of its Bollinger Band
- If %B is high, then the market is in the upper end of its Bollinger Band.
VIX’s weekly %B was recently very low, at just 11%
Here’s what happens next to VIX when it sits in the bottom 15% of its weekly Bollinger Band range.
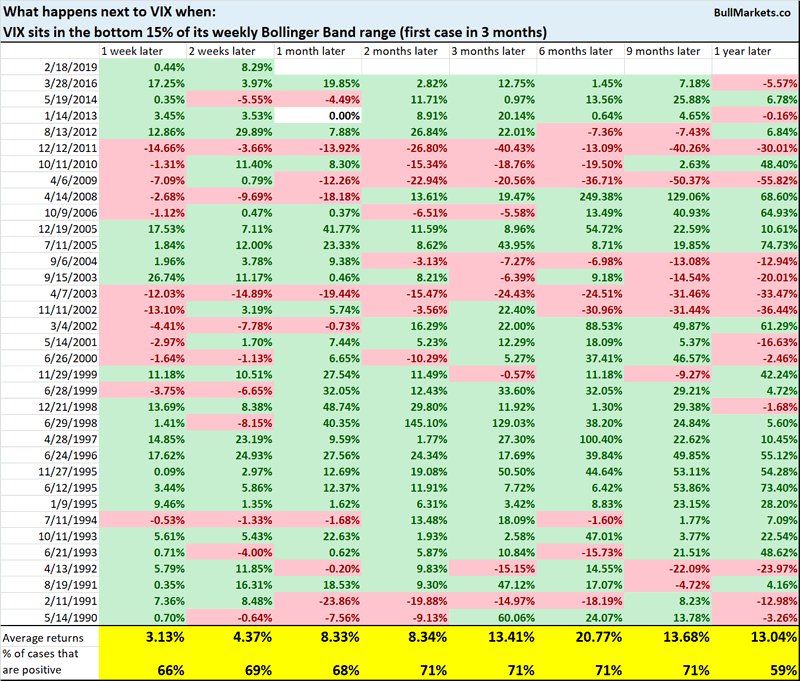
As you can see, VIX has a slight bullish lean on almost all time-frames.
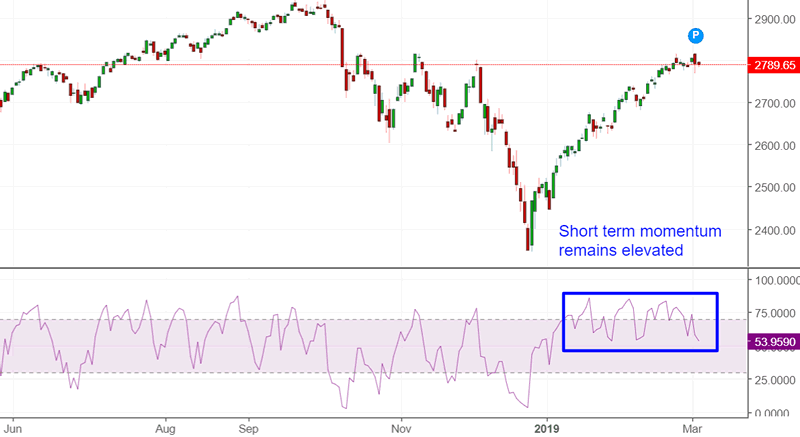
Stable RSI
The S&P’s 5 day RSI has been above 50 for 41 consecutive days. In other words, there has not been a single notable pullback in a long time.
*We used to look at RSI’s support and resistances years ago when we traded the S&P using a discretionary method.
Such long streaks of strong momentum are rare. From 1950 – present, this has only happened 4 other times.
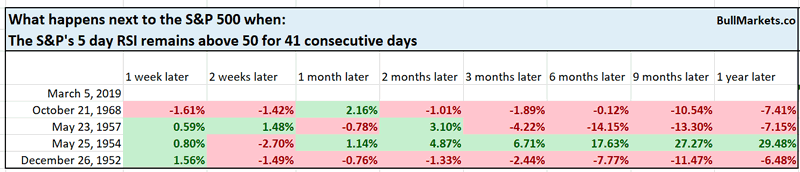
Interestingly enough, 3 of those 4 historical cases saw the S&P lower 3-12 months later.
On the surface, this seems to be a long term bearish sign for stocks. But n=4, so I would take this with a grain of salt.
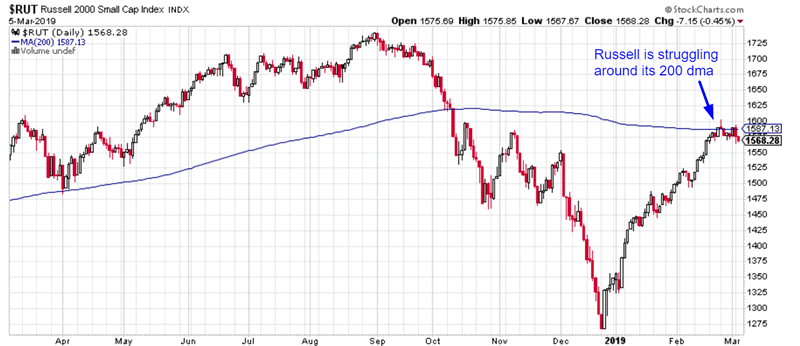
Russell weakness
The S&P, Dow, and NASDAQ have cleared their 200 day moving averages. Unlike other indices, the Russell 2000 (small caps) is struggling under its 200 dma.
Is this a short term bearish sign for stocks? (Resistance is working)
Here’s what happens next to the S&P and Russell when the Russell stays within 1% of its 200 dma for 10 consecutive days.
*Data from 1987 – present
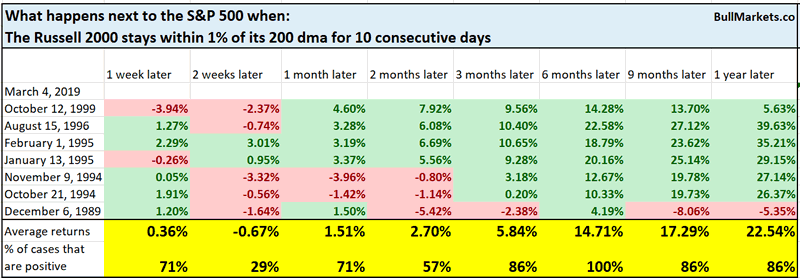
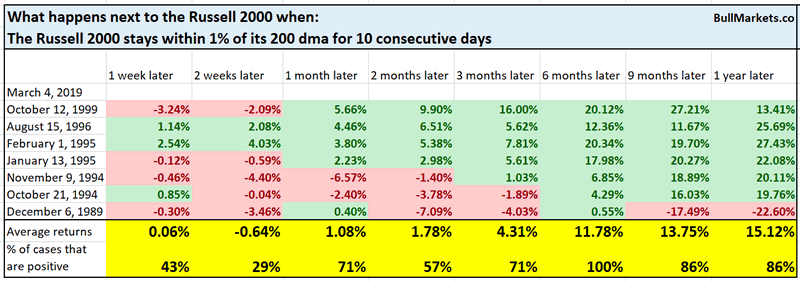
As you can see, this is a short term bearish sign for stocks over the next 2 weeks. But interestingly enough, it was bullish 6-12 months later.
Sentiment
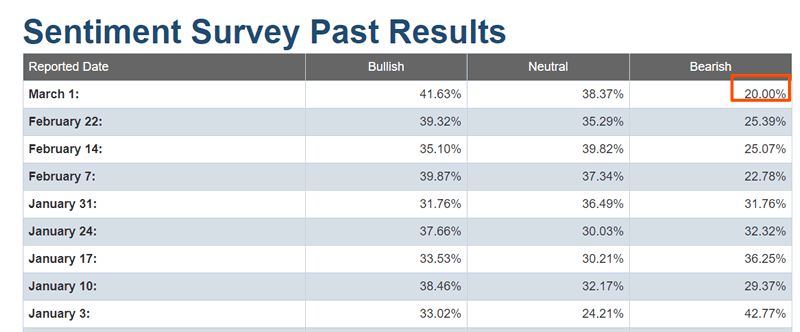
The latest reading from AAII saw Bearish sentiment fall to 20%. The last time bearish sentiment was this low was January 2018, just before the stock market’s sudden drop in February 2018.
*Be careful when someone tells you “the last time XYZ happened was [insert stock market crash date]”. That’s recency bias. If the last time XYZ happened, the stock market crashed, but the 40 other times it happened, the stock market didn’t crash, then XYZ is not a bearish indicator. Permabears love to use recency bias to stoke your fears.
Here’s what happens next to the S&P when AAII Bears falls to 20% or less.
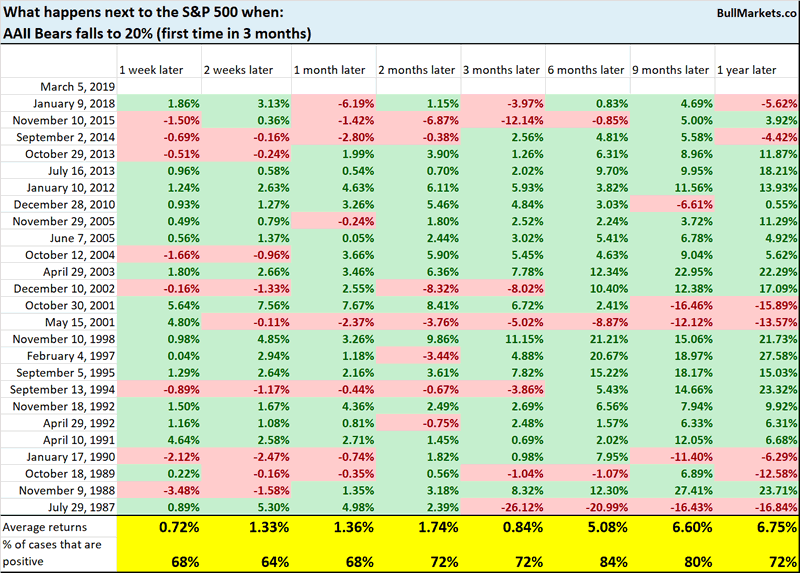
One would expect this to be a short term bearish sign for stocks. It isn’t. 6 months later, the stock market has a higher than average chance of going up.
Click here for yesterday’s market analysis
Conclusion
Here is our discretionary market outlook:
- The U.S. stock market’s long term risk:reward is no longer bullish. In a most optimistic scenario, the bull market probably has 1 year left. Long term risk:reward is more important than trying to predict exact tops and bottoms.
- The medium term direction (e.g. next 6-9 months) is more bullish than bearish.
- The stock market’s short term has a bearish lean due to the large probability of a pullback/retest. Focus on the medium-long term (and especially the long term) because the short term is extremely hard to predict.
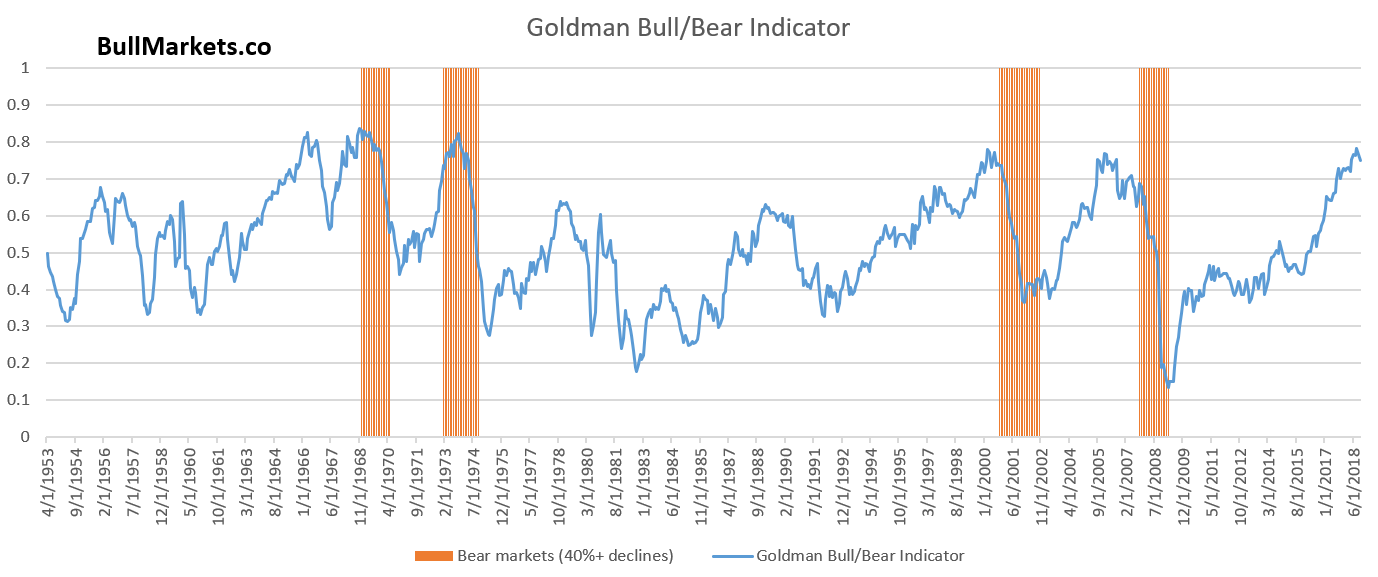
Goldman Sachs’ Bull/Bear Indicator demonstrates that while the bull market’s top isn’t necessarily in, risk:reward does favor long term bears.
Our discretionary outlook is not a reflection of how we’re trading the markets right now. We trade based on our quantitative trading models.
Members can see exactly how we’re trading the U.S. stock market right now based on our trading models.
Click here for more market studies
By Troy Bombardia
I’m Troy Bombardia, the author behind BullMarkets.co. I used to run a hedge fund, but closed it due to a major health scare. I am now enjoying life and simply investing/trading my own account. I focus on long term performance and ignore short term performance.
Copyright 2019 © Troy Bombardia - All Rights Reserved
Disclaimer: The above is a matter of opinion provided for general information purposes only and is not intended as investment advice. Information and analysis above are derived from sources and utilising methods believed to be reliable, but we cannot accept responsibility for any losses you may incur as a result of this analysis. Individuals should consult with their personal financial advisors.
© 2005-2022 http://www.MarketOracle.co.uk - The Market Oracle is a FREE Daily Financial Markets Analysis & Forecasting online publication.