


Fed Balance Sheet QE4EVER - Stock Market Trend Forecast Analysis
Stock-Markets / Stock Markets 2019 Mar 01, 2019 - 07:55 AM GMTBy: Nadeem_Walayat

The stock market soared has soared since the start of 2019, this despite President Trump shutting much of the US government down for 5 weeks accompanied by increasing global economic doom and gloom from a slowdown in China, to Germany teetering on the brink of recession a with Italy already having tipped into recession. And if that were not bad enough we have the train wreck that is BrExit, not the decision to LEAVE the European Union but rather the failure of the UK government / Parliament to implement BrExit in a competent manner, far from it, Parliament has been paralysed with the UK government look set to beg the EU for an extension to Article 50. Nevertheless the major stock indices such as the Dow and the FTSE have SOARED! Confounding not just the usual perma doom merchants out there but much of the mainstream press because most of that which the press peddles has been BAD NEWS!
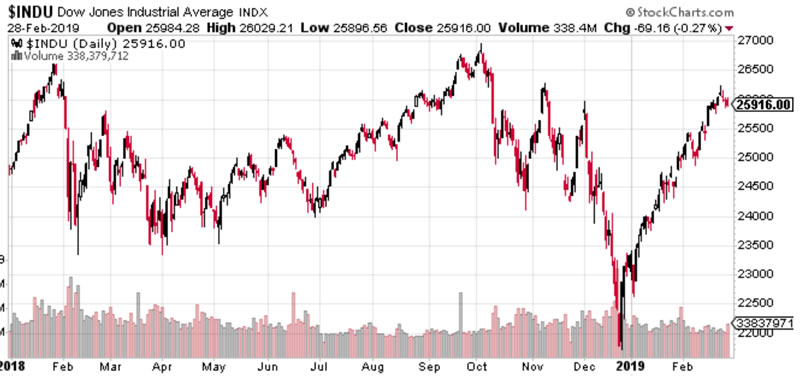
(Charts courtesy of stockcharts.com)
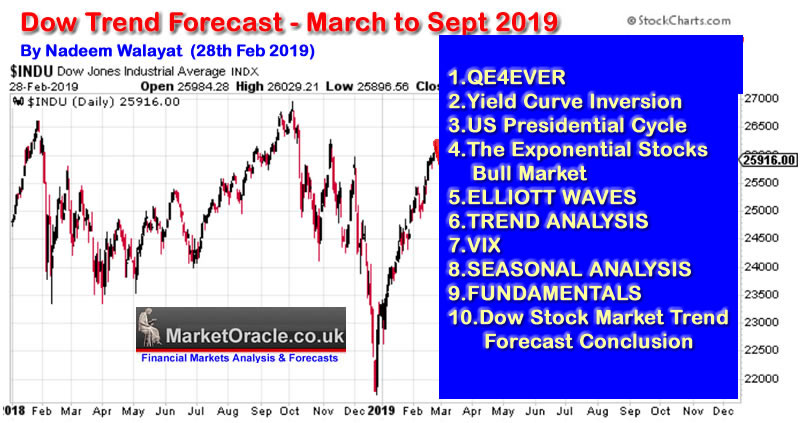
This is the first in a series of articles that concludes in a detailed trend forecast for the Stock Market Dow Stocks Index covering the period from March 2019 to September 2019.
- QE4EVER
- Yield Curve Inversion
- US Presidential Cycle
- The Exponential Stocks Bull Market
- ELLIOTT WAVES
- TREND ANALYSIS
- VIX
- SEASONAL ANALYSIS
- FUNDAMENTALS
- Dow Stock Market Trend Forecast Conclusion
However, the whole of this analysis has first been made available to Patrons who support my work.
So for immediate First Access to ALL of my analysis and trend forecasts then do consider becoming a Patron by supporting my work for just $3 per month. https://www.patreon.com/Nadeem_Walayat.
So why has the the stock market soared, what is that the stock market knows that most commentators and economists fail to comprehend? We'll for one thing there are the dovish signals out of the Fed which go beyond a pause in their interest rate hiking cycle in response to a subdued inflation outlook. Similarly the worlds other major central banks have their own reasons to avoid rate hikes, most notable of which is the Bank of England that has been busy propagandising the prospects of a NO Deal Brexit Armageddon in attempts to scare Westminister into avoiding EXITING the European Union in anything other than an ultra soft BrExit.
So on face value the stock market is clearly discounting not just a more accommodative interest rate environment but that QE REALLY IS FOREVER! Once it starts it DOES NOT STOP! As evidenced by the Fed's balance sheet first having exploded from about $800 billion to over $4.5 trillion, all to bailout the banking crime syndicate by inflating asset prices such as housing and stocks so as to generate artificial profits for the central bankers banking brethren. But none of this news, for I have written of it for a good 10 years now that QE will never stop as the worlds central banks will repeatedly expand QE to monetize government debt.
03 Dec 2009 - Britain's Inflationary Debt Spiral as Bank of England Keeps Expanding Quantitative Easing
Britain's Debt Spiral Ensures Quantitative Easing Will Continue
Quantitative Easing now totals £200 billion which equates to about 15% of GDP which compares against U.S. Q.E. at approx 5% of GDP which illustrates that Britain is further on the path towards higher relative inflation than most major economies and therefore targeting a weaker exchange rate despite competitive devaluation.
The Bank of England will not stop printing money whilst huge budget deficits persist that will not be borne but he open market which would demand much higher interest rates. As the total national debt grows then so will the interest payments demanded to service this debt which means that the deficits will expand further which means even more money printing. Back in 2007 public sector net debt was about £534 billion which demanded interest payments of about £24 billion, now it is over £1 trillion demanding about £36 billion in annual interest payments. However as the government is eventually forced to raise interest rates by the market then so will the debt burden grow both as a consequence of the higher rates and higher next public debt that in 4 years time could demand annual interest payments as high as £100 billion per annum. Therefore Britain HAS entered into a vicious money printing cycle towards much higher inflation than we have experienced during the past 10 years where even if the economy grows increasing tax receipts will not be able to bridge the ever growing gap between income and expenditure including ever higher interest payments hence the perpetual debt spiral.
The implications of the debt spiral should be seen in the currency markets which does not bode well for a stable exchange rate, off course as mentioned earlier competitive devaluations as a consequence of other countries also to varying degrees immersed in their own debt spirals suggests that the real impact will be seen in inflation data and fiat currency alternatives such as GOLD.
Fast forward to the present, and the likes of the Fed have already halted unwinding of QE after barely reducing the Fed balance sheet by 10% from $4.5 trillion to $4 trillion. What does this mean? It MEANS if the Fed starts to even smell a recession or financial sector distress then it's going to start printing money again that would soon take QE to well beyond the previous $4.5 trillion peak, perhaps doubling it's balance sheet during every future crisis or recession given how successful QE was in averting financial Armageddon during the 2008 financial crisis, all without sparking general price inflation.
So I would not be surprised that WHEN the next crisis or recession materialises, QE will resume, by the end of which the Fed balance sheet will likely have DOUBLED to at least $8 trillion. And it is this which the stock market is DISCOUNTING! Just as has been the case for the duration of this QE driven stocks bull market that clearly paused during 2018 in the wake of mild Fed unwinding of its balance sheet. So forget any lingering Fed propaganda for the continuing unwinding it's balance sheet, the actual rate of of which has slowed to a trickle and thus we are probably near the point when the Fed ceases unwinding it's balance sheet because as I have often voiced that once QE starts it does NOT STOP!
The whole of this analysis has first been made available to Patrons who support my work.
So for immediate First Access to ALL of my analysis and trend forecasts then do consider becoming a Patron by supporting my work for just $3 per month. https://www.patreon.com/Nadeem_Walayat.
Your Analyst
Nadeem Walayat
Copyright © 2005-2019 Marketoracle.co.uk (Market Oracle Ltd). All rights reserved.
Nadeem Walayat has over 30 years experience of trading derivatives, portfolio management and analysing the financial markets, including one of few who both anticipated and Beat the 1987 Crash. Nadeem's forward looking analysis focuses on UK inflation, economy, interest rates and housing market. He is the author of five ebook's in the The Inflation Mega-Trend and Stocks Stealth Bull Market series that can be downloaded for Free.


 Nadeem is the Editor of The Market Oracle, a FREE Daily Financial Markets Analysis & Forecasting online publication that presents in-depth analysis from over 1000 experienced analysts on a range of views of the probable direction of the financial markets, thus enabling our readers to arrive at an informed opinion on future market direction. http://www.marketoracle.co.uk
Disclaimer: The above is a matter of opinion provided for general information purposes only and is not intended as investment advice. Information and analysis above are derived from sources and utilising methods believed to be reliable, but we cannot accept responsibility for any trading losses you may incur as a result of this analysis. Individuals should consult with their personal financial advisors before engaging in any trading activities.
Nadeem Walayat Archive |
© 2005-2022 http://www.MarketOracle.co.uk - The Market Oracle is a FREE Daily Financial Markets Analysis & Forecasting online publication.