


The Next Big Stock Market Indicator: Unemployment
Stock-Markets / Stock Markets 2019 Feb 27, 2019 - 05:00 PM GMTBy: Harry_Dent

 I’m always on the lookout for leading indicators that can give us an edge over erratic, irrational markets.
There are a lot of them.
Some are complicated, like the popular composite index from the Conference Board. It includes average weekly hours by manufacturing workers, initial applications for unemployment, new manufacturing orders for consumer goods, speed of delivery from suppliers to vendors, new orders for capital goods, new residential building permits, S&P 500 stock index, inflation-adjusted money supply (M2), spread between long- and short-term rates, and consumer sentiment.
Yes, complex AND a mouthful!
And not necessarily the best indicator to rely on.
Often, simpler indicators work best…
For example, Philosophical Economics found a new one that seems the most accurate: The change in the unemployment rate, when it’s just crossing zero towards negative, is a warning sign.
Or more precisely, when the latest unemployment rate crosses over its simple 12-month moving average… it’s telling.
Here’s the chart…
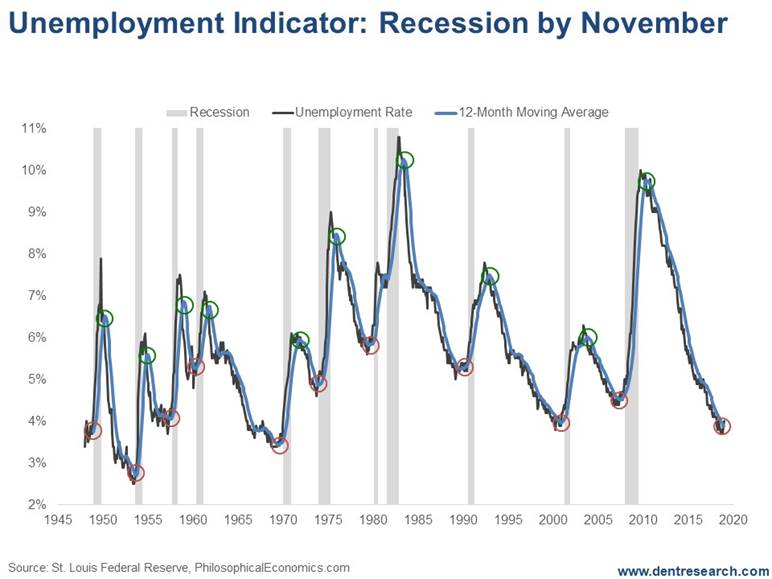
This indicator works at tops AND bottoms, as you can see in the red and green circles on the chart.
Today, we’re focusing on the red circles, which would project a recession in the months ahead.
The lead time for picking the next recession varies between zero and nine months. The average since 2009 has been 3.45 months.
But recent years have tended to be longer…
The December 2017 recession onset was preceded nine months by the warning signal from the end of March reported in early April.
We just got a new signal in early February from the January figure. It’s warning that we could see a recession start by November, at the latest… maybe earlier.
That means stocks could peak a little ahead, as they did in 2017, around September… and that is the exact anniversary of the 1929 crash on my Bubble Buster 90-Year Cycle!
All of which is right in line with my Dark Window time table.
There’s also my favorite indicator – the Dow Jones Home Construction Index – that I talk of often. It was the best predictor of the 2007 top and crash, leading the collapse by a whopping 26 months.
Well, it suggests a stock top in very early 2020…
So, my range of estimates for the ultimate bubble peak of our era has been September 2017 to March 2020, with January 2020 as the most likely…
But with this new unemployment indicator, September looks more likely to be when we see that market top!
I showed a new revers head-and-shoulders pattern in stocks in today’s 5 Day Forecast, which would project a modest correction back to 24,000 on the Dow before a surge up to new highs around 30,000 by June. Then a final wave up to follow.
Could our Dark Window blow-off rally see a Dow of as high as 33,000, or a Nasdaq as high as 10,000 by September? Absolutely!
And that will shock everyone, even the strongest bulls.
Harry
Follow me on Twitter @HarryDentjr
P.S. Another way to stay ahead is by reading the 27 simple stock secrets that our Seven-Figure Trader says are worth $588,221. You’ll find the details here.
Harry studied economics in college in the ’70s, but found it vague and inconclusive. He became so disillusioned by the state of the profession that he turned his back on it. Instead, he threw himself into the burgeoning New Science of Finance, which married economic research and market research and encompassed identifying and studying demographic trends, business cycles, consumers’ purchasing power and many, many other trends that empowered him to forecast economic and market changes.
Copyright © 2019 Harry Dent- All Rights Reserved Disclaimer: The above is a matter of opinion provided for general information purposes only and is not intended as investment advice. Information and analysis above are derived from sources and utilising methods believed to be reliable, but we cannot accept responsibility for any losses you may incur as a result of this analysis. Individuals should consult with their personal financial advisors.
© 2005-2022 http://www.MarketOracle.co.uk - The Market Oracle is a FREE Daily Financial Markets Analysis & Forecasting online publication.