


Trade Talks Drive Stock Market
Stock-Markets / Stock Markets 2019 Feb 24, 2019 - 06:51 PM GMTBy: Andre_Gratian

 Current Position of the Market
SPX: Long-term trend – Long-term trend resuming?
Intermediate trend – Initial rally is likely coming to an end.
Analysis of the short-term trend is done on a daily basis with the help of hourly charts. It is an important adjunct to the analysis of daily and weekly charts which discusses the course of longer market trends.
Daily market analysis of the short term trend is reserved for subscribers. If you would like to sign up for a FREE 4-week trial period of daily comments, please let me know at ajg@cybertrails.com
Trade Talks Drive Market
Market Overview
This week, I might as well repeat what I said last week: “Hope that trade negotiations with China will bring some tangible results have kept the SPX in an uptrend for the past few days, but the technical picture shows a market which is on its last leg.” That last leg, however, is hangin’ tough! Under these conditions, technical readings can stretch out instead of producing more immediate results. With the negotiations having been extended into the weekend, even if some break-throughs are achieved, some “selling on the news” could take place next week. Of course, there are other factors which are affecting investors such as what are the Fed’s intentions, and the signs of weakness appearing in the economy.
In the meantime, patience is worth its weight in gold! This extended rally has benefited the weekly indicators which are positive and moving higher every week, while the daily have topped and are showing negative divergence. The hourly readings briefly went negative last week with an SPX decline of 25 points which was promptly bought when news emerged that the current talks would be extended. This has brought the hourly indicators into another state of negative divergence which awaits the next decline.
Until last week, there was little congestion showing, indicating that we were not quite there yet. Congestion signifies that a bull/bear (demand/supply) battle is taking place with the one which is victorious determining the near-term trend. The next-to-last battle took place around 2650, with the bulls emerging as the victors and driving the index to 2735, where another brief skirmish took place (again won by the bulls) and resulting in getting us to where we are currently, with perhaps a little more to go. Stopping here would create a larger congestion level which, if the battle is won by the bears this time, could result in the beginning of a larger decline.
Chart Analysis (The charts that are shown below are courtesy of QCharts)
SPX daily chart
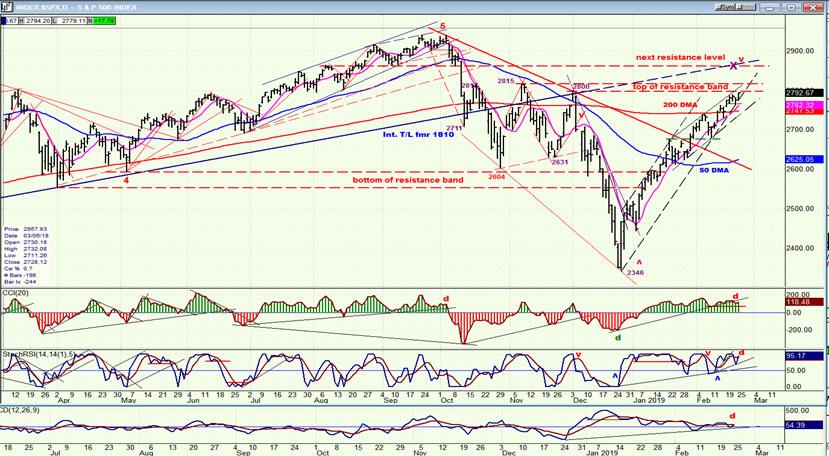
A cursory look at the chart tells us that things are looking just a little more dicey for the bulls than they did last week! This is particularly apparent in the oscillators which are unified in showing negative divergence as the index progressed a little higher this week. They are all itching to go negative and take the price with them!
The index chart started to lose momentum when it formed a second channel which has kept prices climbing, but at a less steep angle. That should not be surprising since the deceleration started at the base of the broad resistance band between 2600 and 2815. The bullish thrust is now reaching the upmost level of that resistance band, coming within 12 points of its top at Friday’s close. If news of a significant breakthrough in the trade talks should be announced over the weekend, it will either cause a “sell on the news” reaction, or push prices through the top of resistance and trigger stops; in which case SPX could quickly find its way to the next resistance level marked on the chart before pulling back.
Projections, divergences, volume, A/Ds, trend lines, etc… etc…, are all tools which, important as they are, should all be taken with a grain of salt. They are only useful warning signs which help us identify a potential trend shift. The price action itself is the final determinant of the trend and trend reversals. When we run out of higher highs, a lower low – in this case below 2764.65 – will be a solid sign that the trend has shifted to the downside. Then, we can start using our tools to attempt predicting the extent of the new trend.
SPX hourly chart
There are two ways that one could interpret the current price action: either as a wedge formed by the trend line from the low and the dashed line across the declining tops or, as two separate trend channels rising at different angles. The main trend line has just been re-adjusted to the last short-term low made on Thursday. If we cannot break through the top of the dashed channel early next week, we should decline below the trend line and challenge the bottom line of the dashed channel. If, on the other hand, renewed strength drives prices through the top of the resistance band, we could then quickly extend the rally to about 2865 (the next resistance level shown on the daily chart), since this would undoubtedly create massive short covering.
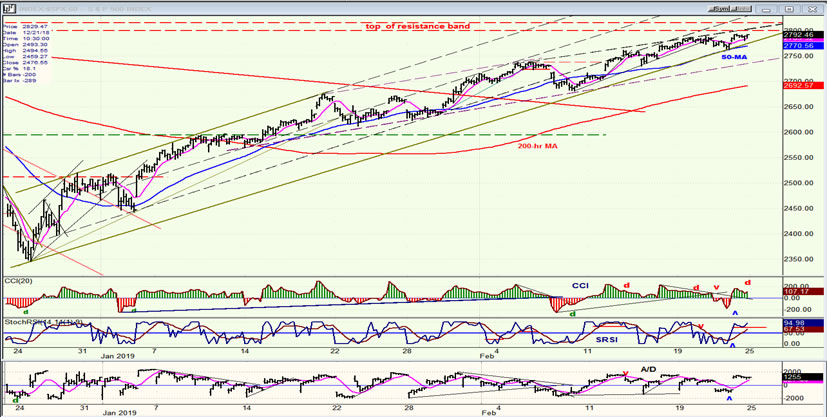
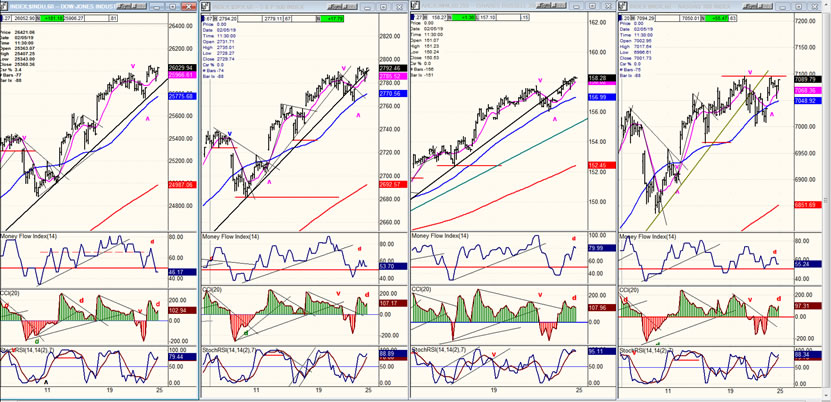
What are the odds of this happening? Probably not good if you believe that things normally come in threes. We are on our third consecutive negative divergence pattern showing on the hourly CCI oscillator. Of course, that could be quickly erased by a continuation of the uptrend. But there is something a little more compelling telling us that a reversal could be imminent. Take a look at the second chart which compares the hourly trend of the four indexes we follow! On that chart, I have added one more indicator: the money flow index. If you can give it any credibility whatsoever, it’s telling us that there is no oomph behind Friday’s push. Again, it’s only an indicator and its reading for that day! More important is what happens on Monday. But I might also point out that NDX has obviously been having increasing difficulty keeping up with the other three! Like IWM, NDX has also often been a leading indicator.
DJIA, SPX, IWM, NDX (daily)
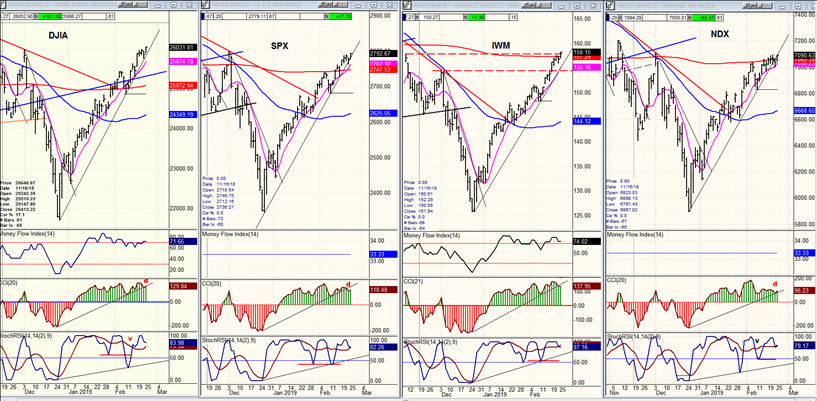
On my charts, the money flow indicator is not available for SPX and NDX at the daily level. Here, it is still strong on both DJIA and IWM, but shows the same deceleration process as is evident on the hourly chart of the SPX and which is represented by the second price channel at a lesser angle. We can also see that NDX is the weakest of the four. Its momentum was arrested by its 200-DMA in early February, and it has not been able to break decisively above it since then. IWM has finally reached its 200-DMA -- which makes it the late comer of the group -- but it’s determination to reach it has also made it the the leader to a new high in the recovery rally. Now that it has arrived, let’s see if its short-term relative strength to the others begins to dissipate, thereby predicting a reversal of the trend. This time, NDX may be the early bird.
UUP (Dollar ETF) (daily)
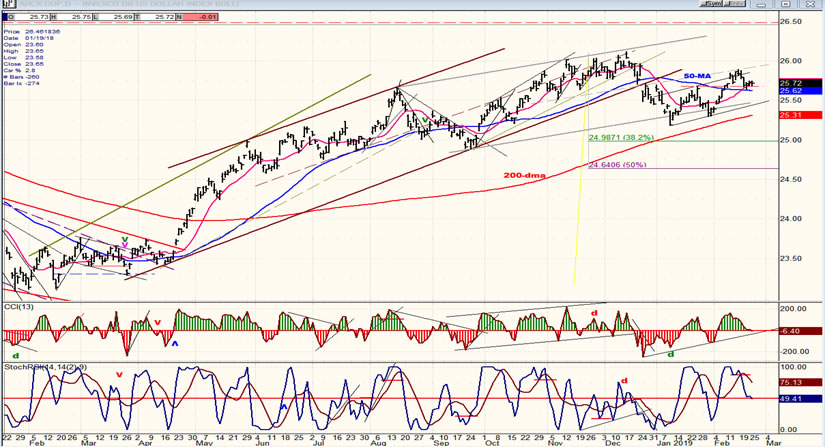
UUP has retraced down to its 50-DMA after breaking above it recently. So far, this seems to be providing a level of support from which it could continue its advance. Both oscillators have only retraced to neutral, which means that the index is not weak, but consolidating. It will become weak, and probably extend its downtrend to its 200-DMA if it trades below the blue MA. Next week’s action is therefore important, especially for GDX, which we will consider next.
GDX (Gold miners ETF) (daily)
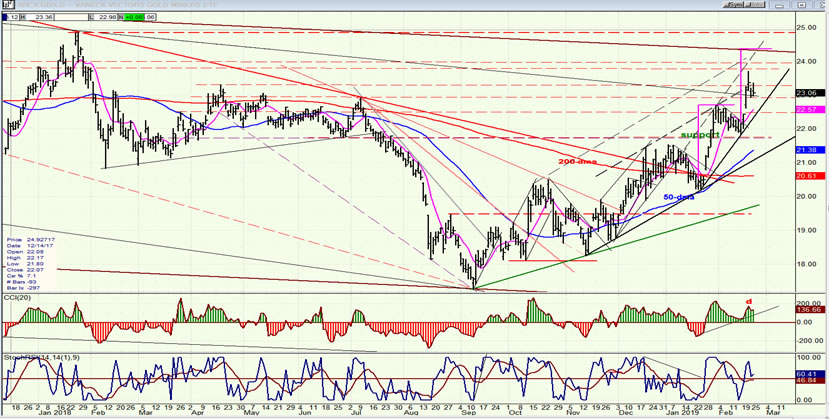
SPX broke out to a new high, as expected, but it stopped short of its intended projection which should be at least to 24.50 -- normal for a move which continues after making a flag pattern. Perhaps we should question if the consolidation was really a flag! Flag patterns are usually very short in duration, and this may be too long a consolidation to be considered a flag. In any case, in spite of its pull-back, it is too soon to say that the index will not reach 24.50. But it cannot tarry at the present level and must reach the projection by March 1. After that, cyclical forces could become adversarial.
CGC (Canopy Growth) (daily)
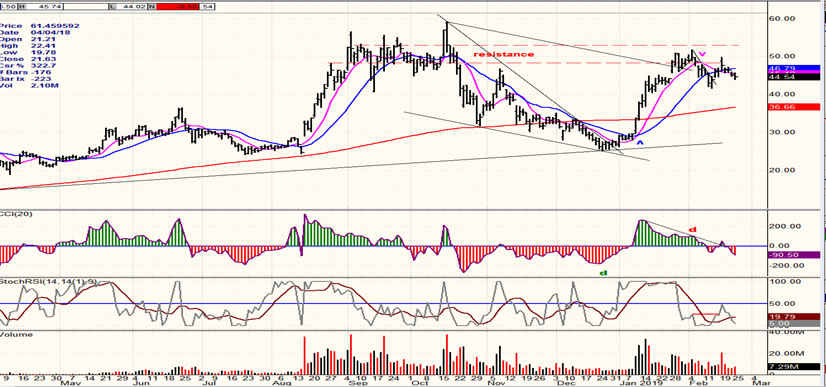
If marijuana’s medicinal properties are truly what they promise to be (beyond CBD), as they become recognized and used in the treatment of a variety of diseases (including cancer), the demand for the weed will grow beyond simply recreational use. This possibility makes following CGC a worthwhile endeavor.
CGC is one of the leaders in this industry. It has undergone broad swings since it woke up about six months ago, and currently appears to be settling in a normal consolidation just under the top of its range. If absorption continues in this area, a move above 50 could quickly send it to a new high, perhaps near 75.
BNO (United States Brent Oil Fund) (daily)
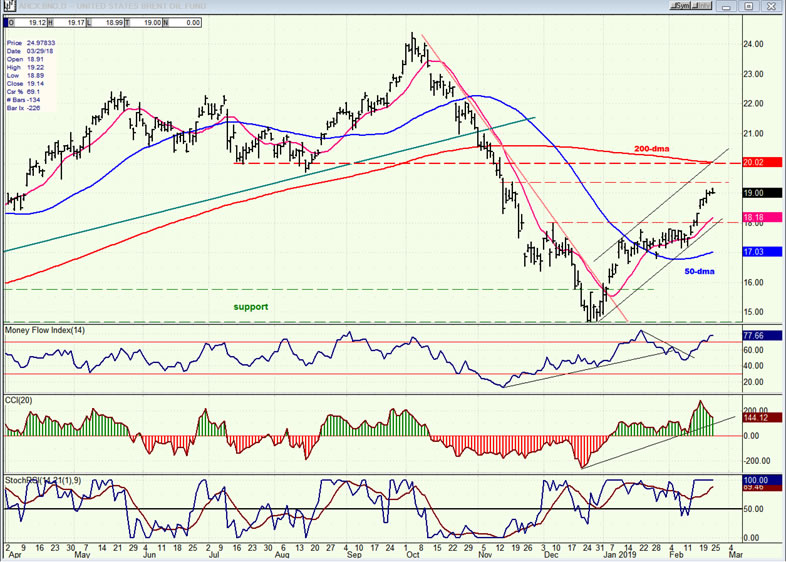
BNO has now retraced more than .382 of its decline and could be aiming for .50. This would put it near its resistance zone and the 200-DMA. At this time, its indicators show no sign of weakness and this gives it a good chance of pushing higher before correcting.
Summary
SPX continues to make topping noises, but it will need to give us a better demonstration that it wants to correct first and move higher later.
Andre
FREE TRIAL SUBSCRIPTON
With a trial subscription, you will have access to the same information that is given to paid subscribers, but for a limited time period. I think you will find that knowing how far a move can carry is one of the most useful benefits of this service, whether you are a trader or an investor -- especially when this price target is confirmed by reliable indicators which give advance warning of a market top or bottom. Furthermore, cycle analysis adds the all- important time element to the above price projections.
For a FREE 4-week trial, further subscription options, payment plans, and for general information, I encourage you to visit my website at www.marketurningpoints.com.
Disclaimer - The above comments about the financial markets are based purely on what I consider to be sound technical analysis principles uncompromised by fundamental considerations. They represent my own opinion and are not meant to be construed as trading or investment advice, but are offered as an analytical point of view which might be of interest to those who follow stock market cycles and technical analysis.
Andre Gratian Archive |
© 2005-2022 http://www.MarketOracle.co.uk - The Market Oracle is a FREE Daily Financial Markets Analysis & Forecasting online publication.