


The Stock Market’s Momentum is Extremely Strong. What’s Next for Stocks
Stock-Markets / Stock Markets 2019 Feb 21, 2019 - 05:34 PM GMTBy: Troy_Bombardia

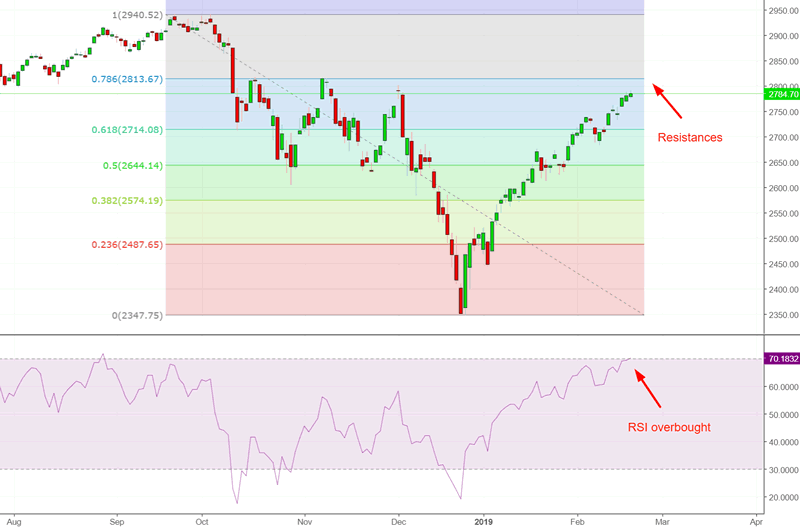
The S&P 500’s nonstop rally continues, and is nearing several resistances at the 2800-2813 level. Meanwhile, the stock market is overbought for the first time in a long time.
Go here to understand our fundamentals-driven long term outlook.
Let’s determine the stock market’s most probable medium term direction by objectively quantifying technical analysis. For reference, here’s the random probability of the U.S. stock market going up on any given day.

*Probability ≠ certainty. Past performance ≠ future performance. But if you don’t use the past as a guide, you are blindly “guessing” the future.
S&P overbought
The S&P 500’s 14 day RSI has become overbought (exceed 70) for the first time in more than 5 months. That’s a very long time, which demonstrates the lack of a persistent rally until now.
Here’s what happens next to the S&P when becomes overbought for the first time in at least 5 months.
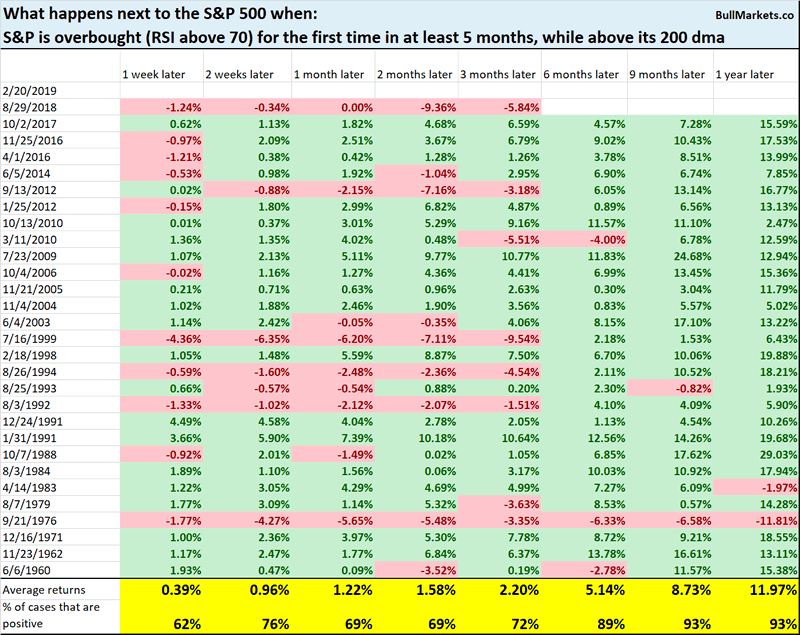
As you can see, the stock market’s short term outlook is mixed, but it’s long term outlook (6-12 months later) is more bullish than random.
The trend is your friend
This rally has been extremely persistent, with the S&P above its 10 day moving average for 32 consecutive days.
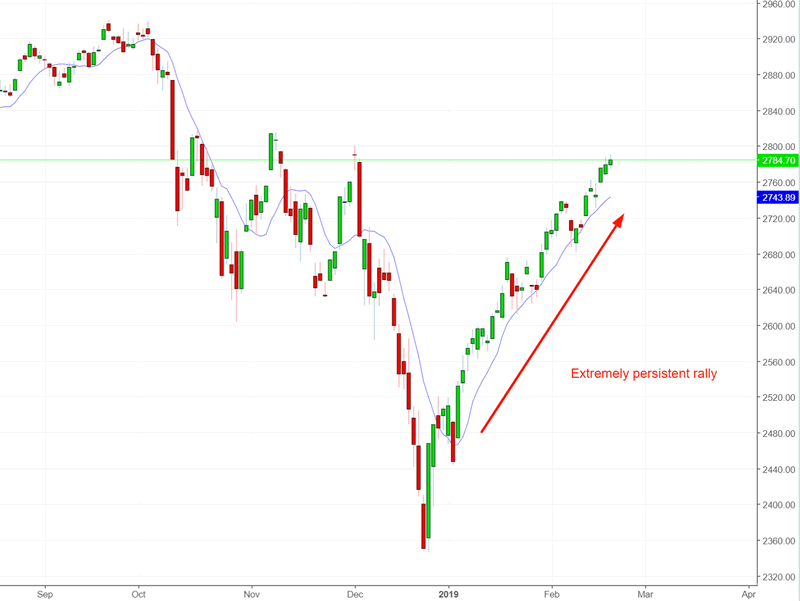
Just because the market has rallied “too much” already, does it mean that a pullback is imminent?
Not necessarily. That’s why well researched factors such as “momentum” exist in the market.
Here are similar historical cases, and what the S&P did next
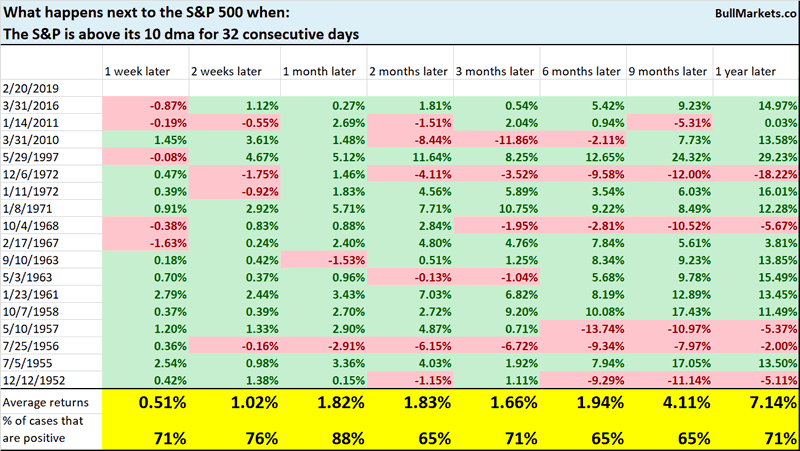
As you can see, the stock market has a bullish bias 1 month later
Perfect Recession
CNBC published a good article about the perfect recession indicator.
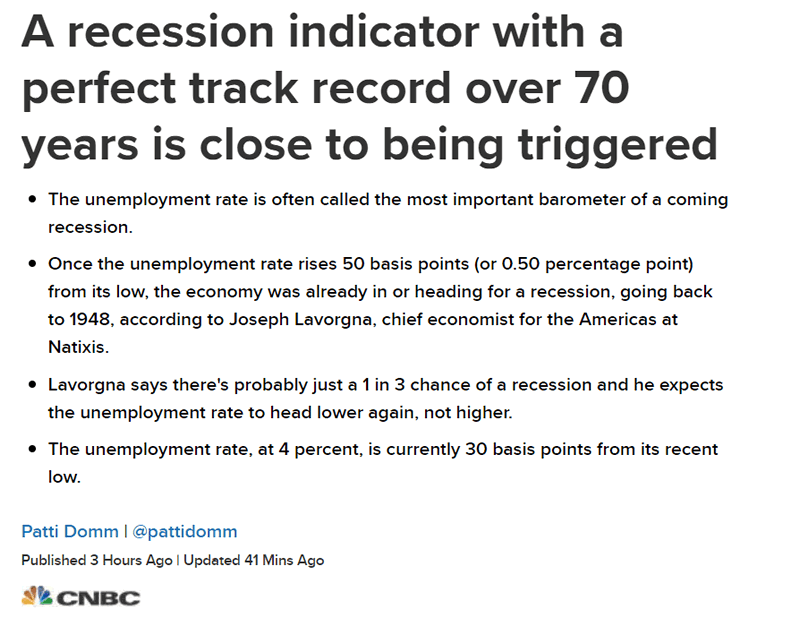
Historically, a 0.5% increase in Unemployment from the lowest reading in each economic expansion guaranteed that a recession had begun. Here’s what the S&P did next
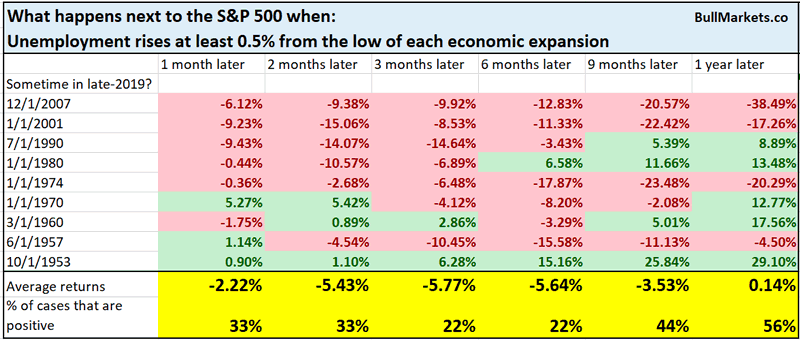
As you can see, this is quite a bearish factor for the S&P.
However, there is one big problem with this indicator.
Only with 20/20 hindsight can you ascertain the low in unemployment of each economic expansion.
E.g. let’s assume that Unemployment rises from 3.8% to 4.3%. You think that this bearish indicator is triggered. Then Unemployment falls to 3.7%, making a new low that invalidates the previous signal.
Regardless, this indicator has not been triggered so far. Unemployment is up 0.3%
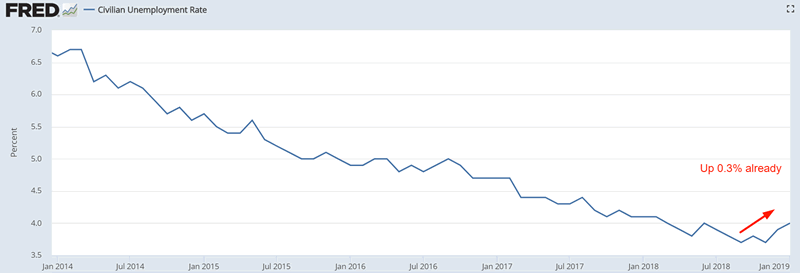
This is not yet a long term bearish sign, but is something to watch out for through the rest of 2019 in case it persists.
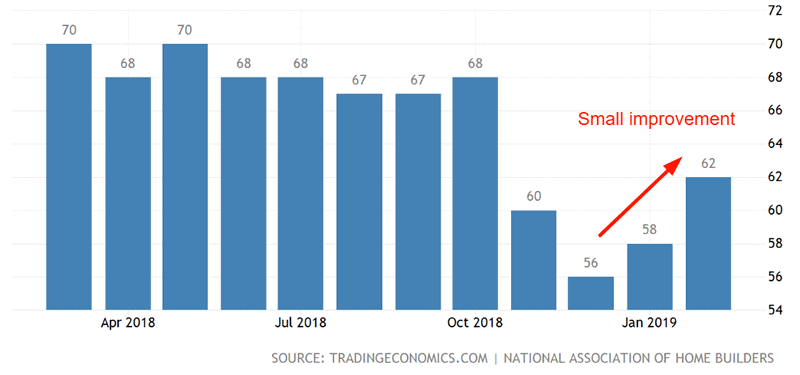
Housing worries
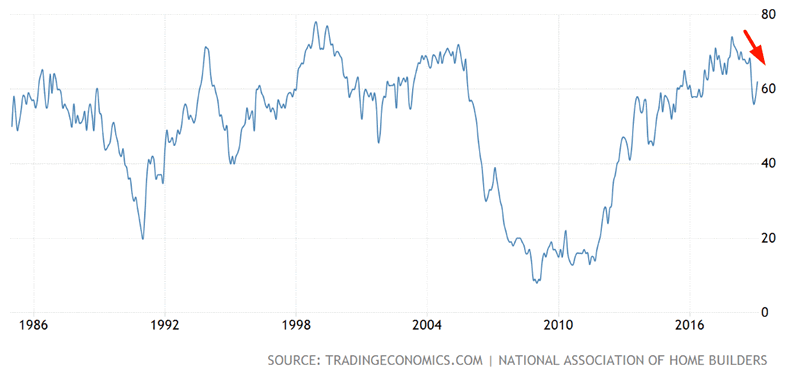
While the housing market improved a little recently, the main trend is still downwards.
Here’s the small improvement in the NAHB Housing Market Index.
Here’s the main trend in the NAHB Housing Market Index.
Here’s what happens next to the S&P when the NAHB Housing Market Index is under its 12 month moving average for 9 consecutive months.
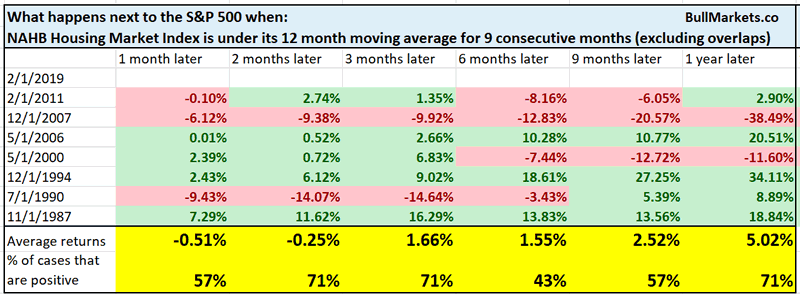
As you can see, this happens near a lot of problems in the stock market and U.S. economy.
- November 1987: this occurred after the October 1987 crash.
- July 1990: this occurred at the start of the 1990 recession and -20% stock market decline
- December 1994: this was a false signal. The economy deteriorated a little in early 1995, yet the stock market soared
- May 2000: this occurred at the top of the dot-com bubble. It was followed by a massive -50% bear market
- May 2006: this occurred 1.5 years before the 2007-2009 bear market
- December 2007: this occurred at the start of the 2007-2009 bear market
- February 2011: a -20% stock market decline began 5 months later
This generally isn’t a good sign for the stock market. It’s not immediately bearish, but it is something bulls should watch out for IF this persists.
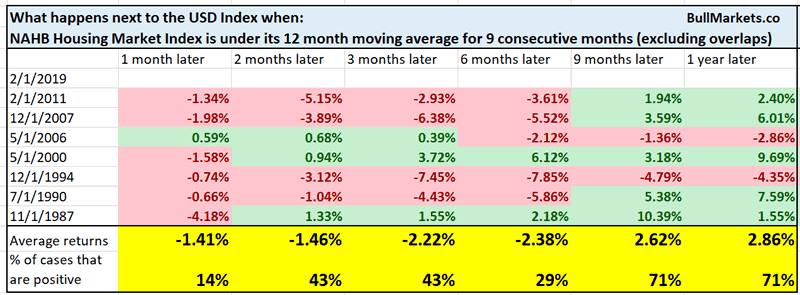
Meanwhile, this is more short term bearish than bullish for the USD Index.
NASDAQ breakout
The NASDAQ broke out above its 200 dma recently, after being deeply oversold in December 2018.
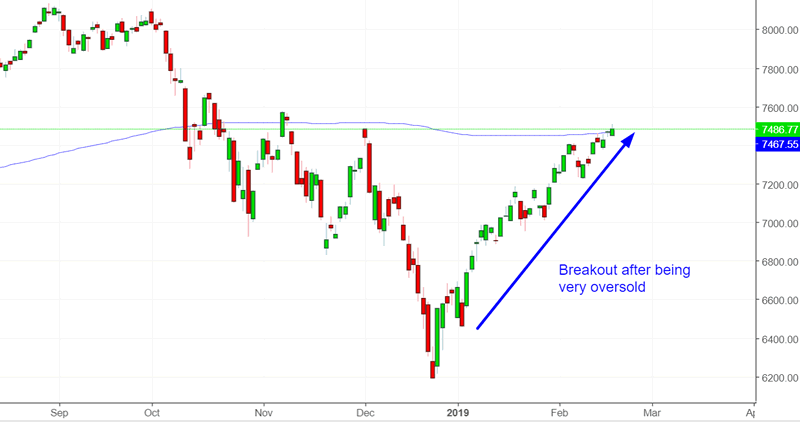
Here’s what happens next to the NASDAQ when it closes above its 200 dma, after being more than -15% below its 200 dma within the past 2 months.
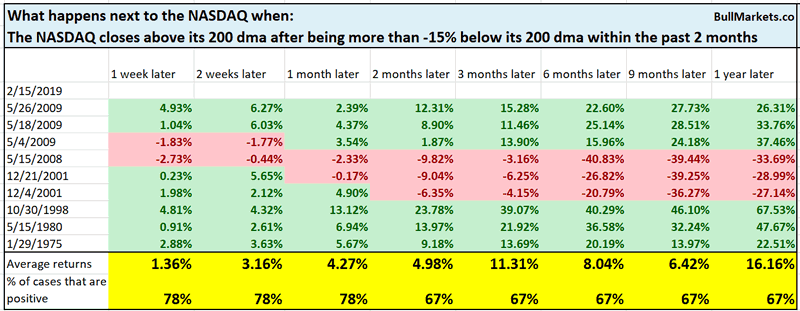
Not consistently bullish or bearish for the NASDAQ
Sustained breadth
Strong breadth remains sustained, with the NYSE McClellan Oscillator above zero for 34 consecutive days. This is an extremely long streak of strong breadth.
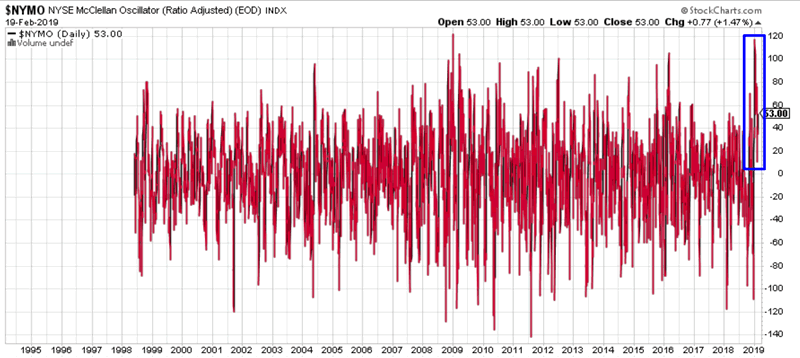
Here’s what happens next to the S&P when the NYSE McClellan Oscillator remains above zero for 34 consecutive days.
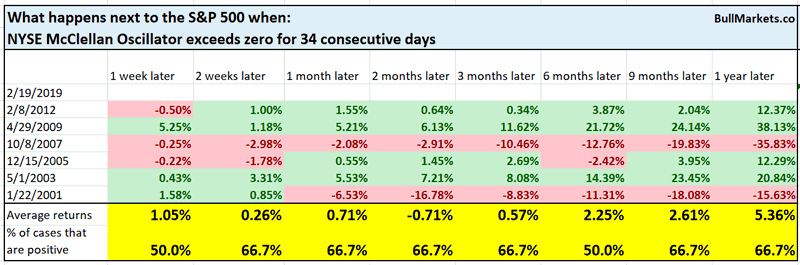
Not consistently bullish or bearish for stocks.
Industrials leading the way
Industrial stocks are leading the stock market’s rally. Over the past 39 days, XLI (industrial sector ETF) has rallied more than 25% while the S&P has rallied less than 19%
From 1998 – present, this has only happened 1 other time in April-May 2009.
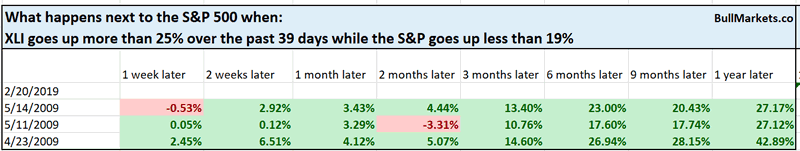
n =1, so take this with a grain of salt
Gold
Gold has been on a tear, rallying along with the S&P. Gold is up more than 5% over the past 39 days while the S&P is up more than 16%.
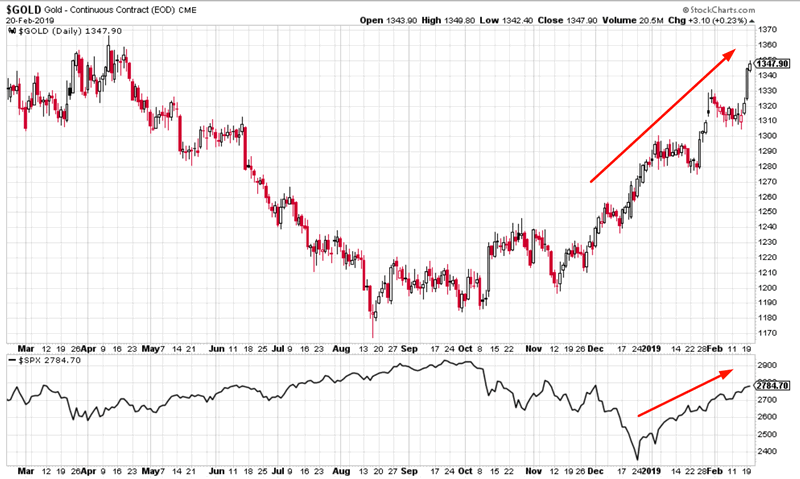
Historically, the only other time gold and stocks surged together was in October 1982
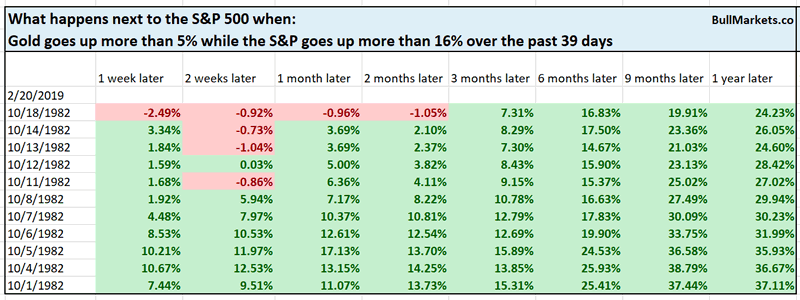
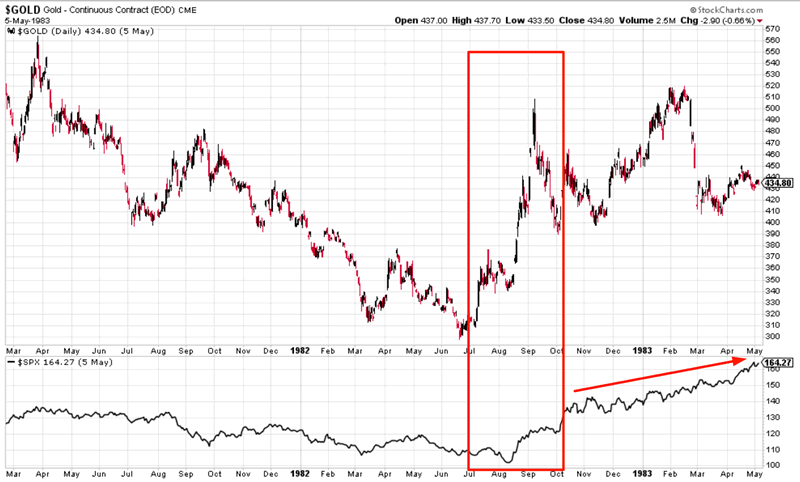
n =1, so take this with a grain of salt
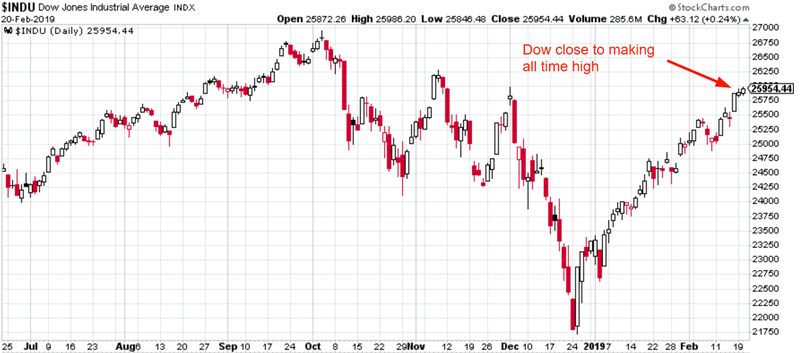
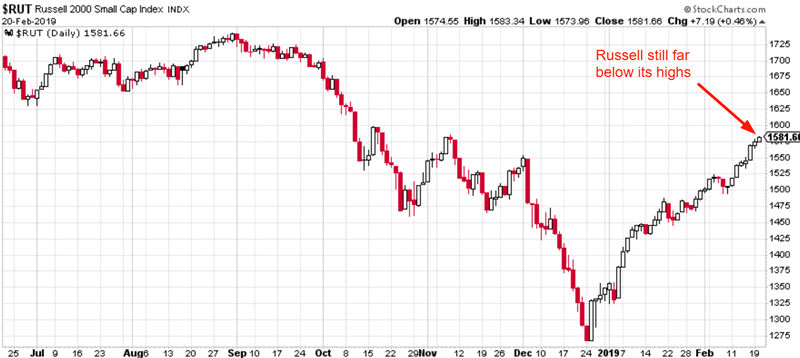
Small cap vs large cap
Large cap stocks are much closer to making new all time highs than small cap stocks. The Dow is within -4% from a 1 year high, while the Russell 2000 is still more than -9% from a 1 year high
What does this mean for the stock market?
*Data from 1987 – present, first case in 1 month
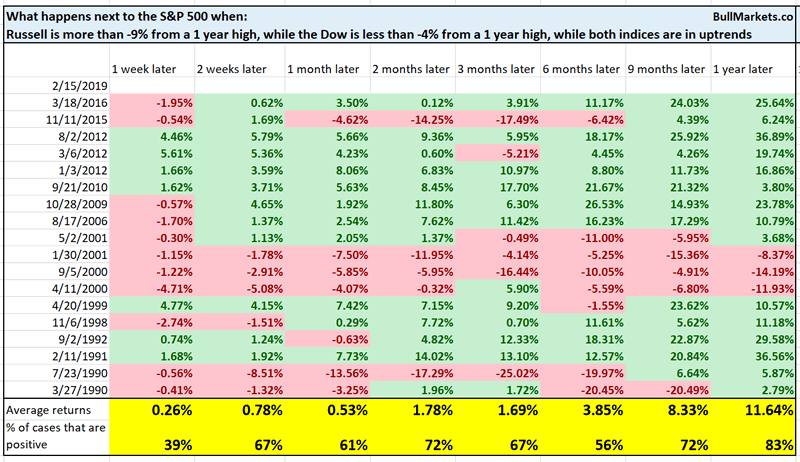
Not much. Aside from a 1 week forward bearish bias, this is neither consistently bullish or bearish for stocks.
Click here for yesterday’s market study
Conclusion
Here is our discretionary market outlook:
- The U.S. stock market’s long term risk:reward is no longer bullish. In a most optimstic scenario, the bull market probably has 1 year left. Long term risk:reward is more important than trying to predict exact tops and bottoms.
- The medium term direction (i.e. next 6 months) is mostly neutral. There are a few more medium term bullish studies than medium term bearish studies
- The stock market’s short term has a bearish lean due to the large probability of a pullback/retest. Focus on the medium-long term (and especially the long term) because the short term is extremely hard to predict.
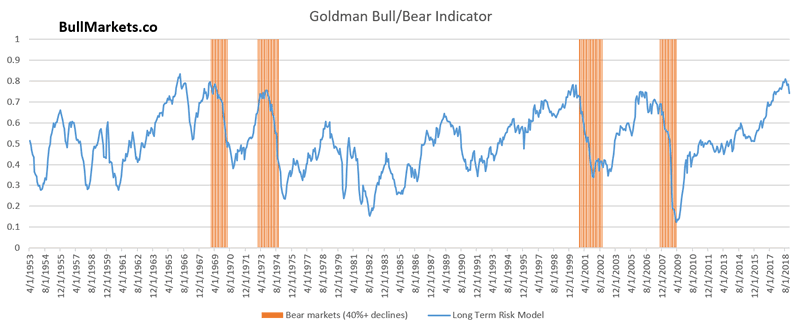
Goldman Sachs’ Bull/Bear Indicator demonstrates that while the bull market’s top isn’t necessarily in, risk:reward does favor long term bears.
Our discretionary outlook is not a reflection of how we’re trading the markets right now. We trade based on our quantitative trading models, such as the Medium-Long Term Model.
Members can see exactly how we’re trading the U.S. stock market right now based on our trading models.
Click here for more market studies
By Troy Bombardia
I’m Troy Bombardia, the author behind BullMarkets.co. I used to run a hedge fund, but closed it due to a major health scare. I am now enjoying life and simply investing/trading my own account. I focus on long term performance and ignore short term performance.
Copyright 2018 © Troy Bombardia - All Rights Reserved
Disclaimer: The above is a matter of opinion provided for general information purposes only and is not intended as investment advice. Information and analysis above are derived from sources and utilising methods believed to be reliable, but we cannot accept responsibility for any losses you may incur as a result of this analysis. Individuals should consult with their personal financial advisors.
© 2005-2022 http://www.MarketOracle.co.uk - The Market Oracle is a FREE Daily Financial Markets Analysis & Forecasting online publication.