


Get ready for the Stock Market Breakout Pattern Setup II
Stock-Markets / Stock Markets 2019 Feb 18, 2019 - 04:59 PM GMTBy: Chris_Vermeulen

 Get ready for one of the most complicated price pattern setups we’ve seen in 4~5 years. Within this multi-part article, we’re highlighting many aspects of our predictive modeling solutions, as well as some very clear patterns that we believe, are tell-all investors to prepare for the next big move. This is the second part of our research, please take a minute to read PART I of this article.
Now for the fun part, lots of charts and a few new predictions…
Recently, the YM (the Dow Futures Contracts) have begun an upside price breakout that we believe is setting up for an incredible price pattern. We’ve been suggesting that capital will focus on certain sectors over the past few months (Finance, Technology, Blue-Chips, and Mid-Caps). We believe the safety provided by these US stocks have become a critical component for many global investors. Thus, we believe the YM, Transports, and sector analysis are critical for skilled traders.
In order to highlight the price pattern that we believe will continue to set up in the YM, we’ve created a series of the chart to build upon the foundation of this pattern as well as to highlight the eventual outcome of this pattern (based on our current research and predictive modeling tools).
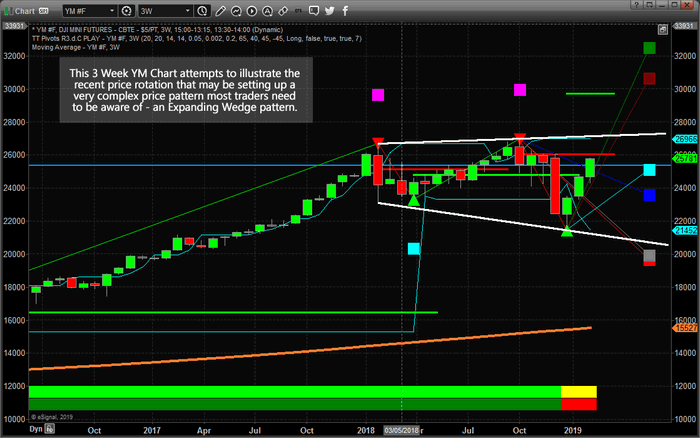
This first chart is a 3 Week YM Chart (where each bar represents a total of 3 weeks). We are attempting to highlight the Expanding Wedge formation that originates near the highs of 2018 and through the early 2018 rotation. It continues to expand through the most recent price rotation near the end of 2018 as well. Our research suggests we are nearing the final leg of this Expanding Wedge formation and we believe this final leg will setup in a very unique pattern that allows skilled traders the opportunity to identify multiple trade entry points. Let’s continue.
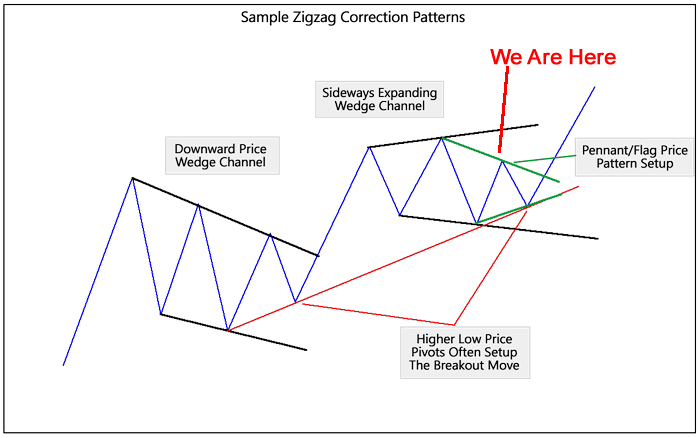
Our research team believes a complex multiple price pattern setup is in the process of forming where, ultimately, a final Pennant/Flag formation will end the complex Wedge formation – setting up a multiple opportunities for skilled traders. The example below highlights an example of the 2015~2019 market price action. We’ve simplified this by manually drawing this image to eliminate the moderate price rotations which can often be confusing for some traders. The intent of this drawing is to show you how and why this pattern is important.
This next Weekly NQ chart shows a bigger picture of the pattern setup. In the first part of this image (roughly 2015/2016), we can see a downward price channel/wedge that sets up. Near the end of this price channel, price sets up a “higher low” which is actually a type of Flag/Pennant formation setup. This “higher low” pattern is unique and important. Remember our Fibonacci price theory from the first part of this article?
Price must ALWAYS attempt to establish new price highs or new price lows AT ALL TIMES. Well, this FAILURE to establish a new price low means only one thing.. it MUST, then, attempt to establish a new price high. The subsequent upside price breakout (a result of a US presidential election cycle as well a renewed optimism) prompted a massive upside price rally in 2017 and created the current Sideways Expanding Wedge formation in early 2018.

The current Wedge formation in this example is a close proximity of the current price rotation in the US markets (you’ll see similarities in some additional chart, below). The important aspect of this current Expanding Wedge is that we continue to expect the Fibonacci “Failed Low” price rotation before the true upside breakout run happens. In other words, we are currently in an upside price rally that is attempting to find/isolate the second peak of the Pennant/Flag formation (Green Below) – where it shows “We Are Here”.
Because of this setup, we are continuing to expect price rotation in the near future that will be very healthy for the overall markets. As we’ve tried to highlight, one of the most critical components of Fibonacci price theory is that “price MUST rotate” while attempting to establish new price highs or new price lows. Price rotation is a very healthy component of any overall trending and price rotation must occur in order for price to continue trending. Thus, what we believe will be the setup pattern in the markets is a Pennant/Flag formation near the end of this Expanding Wedge formation. We believe this Pennant/Flag formation is currently attempting to identify the “second peak” and we believe the next downside price rotation could be in the range of -4% to -5.5% from current highs.
This last chart highlights a longer-term perspective of our analysis and attempts to highlight the range and expectation of the future Pennant/Flag formation. We’ve drawn this Pennant/Flag formation in MAGENTA (pink) and highlighted the individual price waves of in RED and GREEN. We’ve also highlighted the Expanding Wedge formation in WHITE.
The range of this recent rotation is much larger than the 2015/2016 price rotation. The breakout move (early 2017 through early 2018) resulted in a +55% upside rally in the YM. Could a new breakout move result in another massive upside move in the YM? If so, how big could this move be? Well, take a look at the projected Fibonacci Price Target Levels on this chart. From the December 2018 lows, these Fibonacci projected price targets represent a +35% (29,940) to +51% (32,500) upside move.
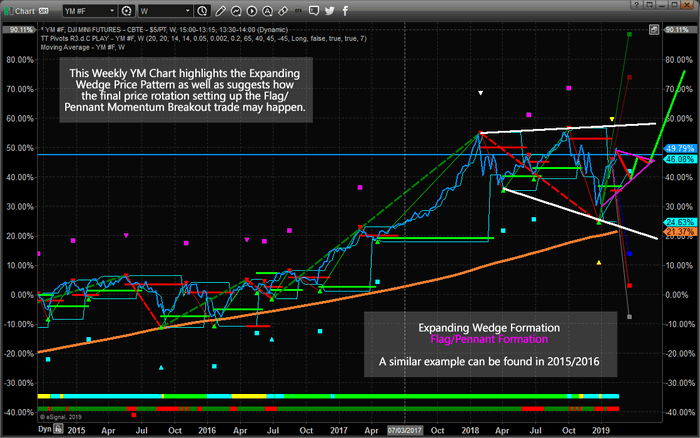
From current YM levels, these targets reflect a +16% to +26%. These are HUGE upside moves.
So, our conclusion is for traders to understand this setup is likely to continue forming over the next 30~45 days and we are expecting a 4~5.5% downside price rotation sometime in the near future. This move will setup the beginning of the Pennant/Flag formation and begin the final setup for the breakout move. It is within this Pennant/Flag formation that we suggest skilled traders begin to position their portfolios for the upside breakout that should eventually result in incredible opportunities. Remember to protect your trade effectively. The Apex of the Pennant/Flag formation may include a “false rotation/breakout” price move. This is when price would attempt to break to the downside, then stall (quickly), then reverse back to the upside and “wash out” a bunch of stops in the process. So be prepared for this move.
Take a look at some of our recent winners to see how we help people, just like you, create success like GDXJ 10.5%, and 18% with ROKU. We believe 2019 and 2020 will be incredible years for skilled traders and we are executing at the highest level we can to assist our members. In fact, we are about to launch our newest technology solution to better assist members and ourselves to create amazing future success. Become a member of our Wealth Trading Newsletter now and get ready for an incredible couple years of trading and investing.
Chris Vermeulen
www.TheTechnicalTraders.com
Chris Vermeulen has been involved in the markets since 1997 and is the founder of Technical Traders Ltd. He is an internationally recognized technical analyst, trader, and is the author of the book: 7 Steps to Win With Logic
Through years of research, trading and helping individual traders around the world. He learned that many traders have great trading ideas, but they lack one thing, they struggle to execute trades in a systematic way for consistent results. Chris helps educate traders with a three-hour video course that can change your trading results for the better.
His mission is to help his clients boost their trading performance while reducing market exposure and portfolio volatility.
He is a regular speaker on HoweStreet.com, and the FinancialSurvivorNetwork radio shows. Chris was also featured on the cover of AmalgaTrader Magazine, and contributes articles to several leading financial hubs like MarketOracle.co.uk
Disclaimer: Nothing in this report should be construed as a solicitation to buy or sell any securities mentioned. Technical Traders Ltd., its owners and the author of this report are not registered broker-dealers or financial advisors. Before investing in any securities, you should consult with your financial advisor and a registered broker-dealer. Never make an investment based solely on what you read in an online or printed report, including this report, especially if the investment involves a small, thinly-traded company that isn’t well known. Technical Traders Ltd. and the author of this report has been paid by Cardiff Energy Corp. In addition, the author owns shares of Cardiff Energy Corp. and would also benefit from volume and price appreciation of its stock. The information provided here within should not be construed as a financial analysis but rather as an advertisement. The author’s views and opinions regarding the companies featured in reports are his own views and are based on information that he has researched independently and has received, which the author assumes to be reliable. Technical Traders Ltd. and the author of this report do not guarantee the accuracy, completeness, or usefulness of any content of this report, nor its fitness for any particular purpose. Lastly, the author does not guarantee that any of the companies mentioned in the reports will perform as expected, and any comparisons made to other companies may not be valid or come into effect.
Chris Vermeulen Archive |
© 2005-2022 http://www.MarketOracle.co.uk - The Market Oracle is a FREE Daily Financial Markets Analysis & Forecasting online publication.