


Shopify (NYSE:SHOP) – Bullish Flag Breakout Higher
Companies / Company Chart Analysis Feb 18, 2019 - 04:31 PM GMT

 Shopify (NYSE:SHOP) is an electronic commerce company offering online stores and retail point of sale platform designed for small and medium-sized businesses. Merchants can design, set up and manage their shops using a single interface which make is an easy and attractive way to start up a business in few clicks.
E-commerce industry been around for almost 3 decades, but the recent 10 years saw a significant growth and with new technologies it took it to the next level which has transformed the processes of buying and selling goods.
Shopify have been in business for 14 years and become one of the leaders in providing e-commerce services. The company has not taken on any debt in the past 5 years and has sufficient cash runway for more than 3 years if free cash flow continues to grow at historical rates of 47.1% each year.
Shopify Future Revenue and Net Income
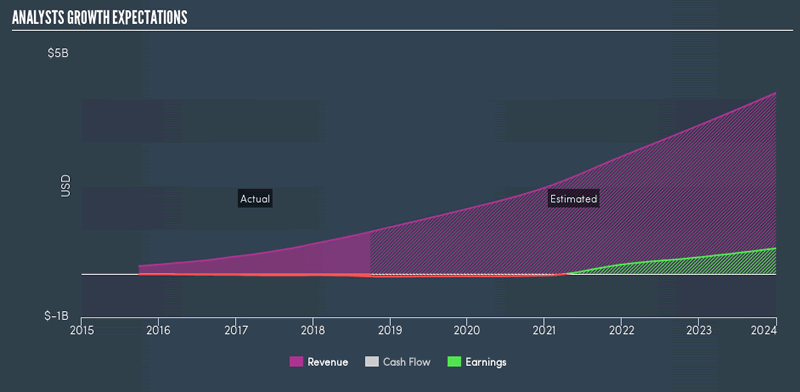
Based on the the current data for Shopify, its earnings and revenue are expected to grow significantly at over 20% yearly putting a solid case for investors to keep it for the future. Its stock (NYSE:SHOP) yearly return outperformed the Information Technology sector and the US Market since the IPO.
Let’s now switch to the technical aspect of SHOP chart with the guidance of Elliott Wave Theory to understand the future path:
Shopify Weekly Elliott Wave Chart
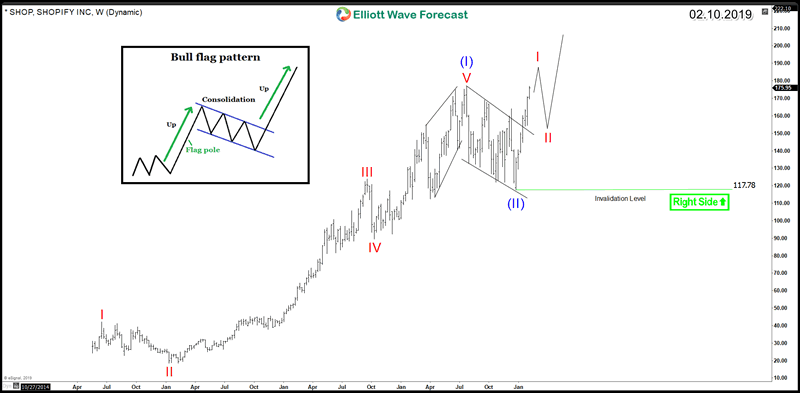
Since IPO, the stock price advanced higher in a classical 5 waves move which design a bullish trend. Therefore, based on the Elliott wave theory, the stock will do another similar 5 waves move in the same direction after a 3 , 7 or 11 swings pullback against the trend.
That’s exactly what’s taking place, SHOP ended the cycle last year as a first leg wave (I) then corrected lower in what appears to be a bullish flag pattern in wave (II) and now the stock is in the process of resuming the main trend by making new all time highs.
The break to the upside is significant in 2 ways: A break of a bullish continuation pattern and more importantly a possible start of a third wave higher which represent the strongest wave in the Elliott wave theory. The minimum measured target for the move is at the 100% Fibonacci extension $275 and the 161.8% comes at $375.
Consequently, Shopify is expected to remain supported above December 2018 low $117 and buyers will be looking for pullbacks in 3 , 7 or 11 swings to enter the market which makes the stock bullish for 2019.
Get more insights about Technology Stocks by trying out our services 14 days . You’ll learn how to trade the market using the 3, 7 or 11 swings sequence. You will get access to our 78 instruments updated in 4 different time frames, Live Trading & Analysis Session done by our Expert Analysts every day, 24-hour chat room support and much more.
By Ayoub Ben Rejeb
https://elliottwave-forecast.com
ElliottWave-Forecast has built its reputation on accurate technical analysis and a winning attitude. By successfully incorporating the Elliott Wave Theory with Market Correlation, Cycles, Proprietary Pivot System, we provide precise forecasts with up-to-date analysis for 52 instruments including Forex majors & crosses, Commodities and a number of Equity Indices from around the World. Our clients also have immediate access to our proprietary Actionable Trade Setups, Market Overview, 1 Hour, 4 Hour, Daily & Weekly Wave Counts. Weekend Webinar, Live Screen Sharing Sessions, Daily Technical Videos, Elliott Wave Setup .
Copyright © 2019 ElliottWave-Forecast - All Rights Reserved Disclaimer: The above is a matter of opinion provided for general information purposes only and is not intended as investment advice. Information and analysis above are derived from sources and utilising methods believed to be reliable, but we cannot accept responsibility for any losses you may incur as a result of this analysis. Individuals should consult with their personal financial advisors.
© 2005-2022 http://www.MarketOracle.co.uk - The Market Oracle is a FREE Daily Financial Markets Analysis & Forecasting online publication.