


IBM Stock Long Term Bullish Trend and Elliott Wave Cycles
Companies / Company Chart Analysis Feb 18, 2019 - 04:06 PM GMT

Firstly I would like to mention Big Blue has been around for over 100 years since it was founded. I have price data that goes back to the 1960’s when the stock price was around three dollars. The point of this article is to show what Elliott Wave technical analysis suggests will happen before the stock price resumes the larger uptrend.
Secondly from the early beginnings of the company up to the March 2013 highs was simply a series of higher highs and higher lows. The weekly chart shown below is where this wave analysis begins. This decline appears to be a zig zag Elliott wave corrective structure. These structures subdivide into what wave analysts call a 5-3-5 structure. This means the first cycle ((A)) lower from the March 2013 highs to the February 2016 lows was a five wave impulse. This impulse had some overlap in between the wave (1) and wave (4). Thus it would be considered a diagonal. The bounce in the ((B)) wave connector subdivides into three corrective swings.
The analysis continues below the weekly chart.
IBM Weekly Chart
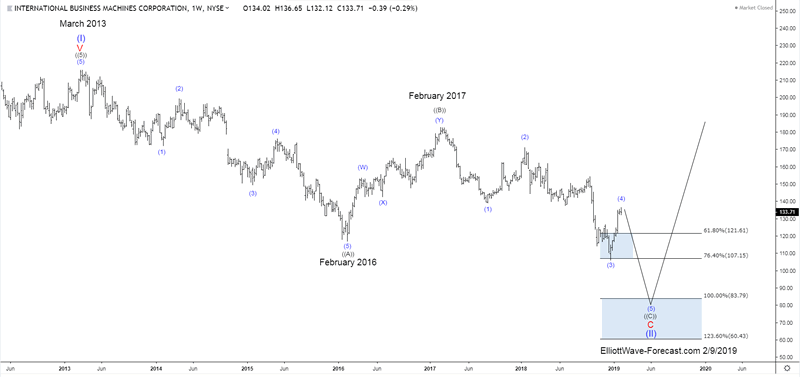
Thirdly from the February 2017 ((B)) highs price has declined in two smaller degree blue (1) & (3) impulse waves. By all means, this is an incomplete larger degree black ((C)) impulse. Currently the wave (4) in blue is correcting the cycle lower from the wave (2) highs. Momentum indicators like RSI should ideally continue showing a lower reading in the wave (4) when compared to the wave (2). Considering the previous impulse wave ((A)) diagonal had some overlap between the wave (1) & (4) it could happen again in the current wave (4) of ((C)). This not a rule requirement. As of right now it appears it may turn back lower without any overlap.
In conclusion as earlier mentioned the sequence lower from February 2017 is incomplete. It is only missing another swing lower under 105.94, the 12/24/18 lows in the impulse ((C)) to finish the zig zag structure. Highlighted on the chart is an ideal area price can reach before resuming the larger uptrend.
Thanks for looking. Feel free to come visit our website and check out our services Free for 14 days to see if we can be of help.
Kind regards & good luck trading.
Lewis Jones of the ElliottWave-Forecast.com Team
https://elliottwave-forecast.com
ElliottWave-Forecast has built its reputation on accurate technical analysis and a winning attitude. By successfully incorporating the Elliott Wave Theory with Market Correlation, Cycles, Proprietary Pivot System, we provide precise forecasts with up-to-date analysis for 52 instruments including Forex majors & crosses, Commodities and a number of Equity Indices from around the World. Our clients also have immediate access to our proprietary Actionable Trade Setups, Market Overview, 1 Hour, 4 Hour, Daily & Weekly Wave Counts. Weekend Webinar, Live Screen Sharing Sessions, Daily Technical Videos, Elliott Wave Setup .
Copyright © 2019 ElliottWave-Forecast - All Rights Reserved Disclaimer: The above is a matter of opinion provided for general information purposes only and is not intended as investment advice. Information and analysis above are derived from sources and utilising methods believed to be reliable, but we cannot accept responsibility for any losses you may incur as a result of this analysis. Individuals should consult with their personal financial advisors.
© 2005-2022 http://www.MarketOracle.co.uk - The Market Oracle is a FREE Daily Financial Markets Analysis & Forecasting online publication.