


Here We Go – Get ready for the Stock Market Breakout Pattern Setup
Stock-Markets / Stock Markets 2019 Feb 17, 2019 - 04:29 PM GMTBy: Chris_Vermeulen

We are writing this post today with a few forward-looking expectations while attempting to warn traders that some extended rotation is likely to enter the markets over the next 30+ days. If you’ve been following our research, you’ll know that we’ve been calling these move months in advance of other researchers and analysts. Our September 17, 2018 research post highlighting our Adaptive Dynamic Learning predictive modeling system suggested the US stock markets were poised for a massive price rotation followed by a very unique price setup that we are experiencing now.
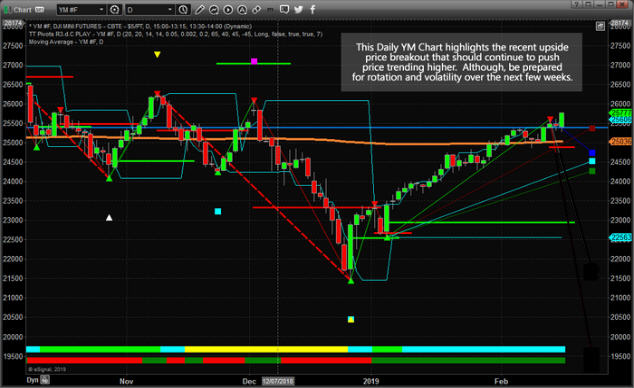
Currently, the YM (Dow Futures Contracts) are leading the pack on a dramatic upside breakout move. This is likely a result of the US government spending bill that is recently working its way towards approval and the fact that this new spending bill clears the way for at least 8+ months of uninterrupted market optimism (or at least we hope). This 300+ point upside move clearly breaks price highs and puts the US stock market, at least the Dow/Blue-Chips, back into “new high trending mode”. As many of you are likely aware, our Fibonacci price study teaches us that price must ALWAYS seek to establish new price highs or new price lows AT ALL TIMES. Thus, these new price highs are a very strong indication that the upside trend is dominant and should continue for a while.
Additionally, we want to highlight what we believe will be a similar price pattern to 2015/2016 in the US markets – a multiple Price Wedge formation that could ultimately set up another price leg (which we believe will be higher, to the upside, at this time).
In the next article “PART II” pay close attention to the charts and images as we are attempting to clearly illustrate how and why price rotation is about to hit the US markets and why you need to be prepared for this move.
We continue to read that large amounts of capital are sitting on the sidelines or have been pulled from the markets over the past 12+ months. We understand this as the rotation in early 2018 frightened many investors and the continued sideways price action, global market concerns and geopolitical issues have caused international investors to want to protect their investments from risk – thus they move their capital into cash. We get it. But we also believe the next breakout in the US markets will be a great opportunity for skilled traders to identify and prepare for an incredible profit potential no matter which way the market breaks up or down because technical analysis allows us to closely follow the direction of the market.
The amount of capital that is sitting on OUTSIDE the markets, currently, represents a massive amount of resources that could re-enter the markets when traders/investors decide the timing is right. We’ve termed this a “Capital Shift”.
In simple terms, it reflects capital/cash moving from one market to another or from actively invested to cash, then back to actively invested. Our belief is that capital operates in a manner to always protect itself from risk while attempting to identify suitable returns. The best environment for capital is always a relatively safe investment with protective values and a high probability of decent returns. Therefore, this massive amount of capital not being deployed in the global markets will, at some time, re-enter the markets and will likely increase pricing valuations.
How and when will this capital re-enter the markets? What will price activity look like and how will we know when the timing is right for our own strategic deployment of our trading capital? Continue reading to learn why we believe we are only 30~45 days away from an incredible trading setup. You won’t want to miss another one of our winners. Recently we close GDXJ for 10.5%, ROKU 8%, and Another ROKU position for 18% profit.
Please take a minute to visit www.TheTechnicalTraders.com to learn how we can help you find and execute better trade in 2019 and stay ahead of these market moves. We are confident that you will find our Daily Video, Detailed Market Research, Proprietary Research Tools and Detailed Trading Signals will help you make 2019 an incredibly successful year.
Chris Vermeulen
www.TheTechnicalTraders.com
Chris Vermeulen has been involved in the markets since 1997 and is the founder of Technical Traders Ltd. He is an internationally recognized technical analyst, trader, and is the author of the book: 7 Steps to Win With Logic
Through years of research, trading and helping individual traders around the world. He learned that many traders have great trading ideas, but they lack one thing, they struggle to execute trades in a systematic way for consistent results. Chris helps educate traders with a three-hour video course that can change your trading results for the better.
His mission is to help his clients boost their trading performance while reducing market exposure and portfolio volatility.
He is a regular speaker on HoweStreet.com, and the FinancialSurvivorNetwork radio shows. Chris was also featured on the cover of AmalgaTrader Magazine, and contributes articles to several leading financial hubs like MarketOracle.co.uk
Disclaimer: Nothing in this report should be construed as a solicitation to buy or sell any securities mentioned. Technical Traders Ltd., its owners and the author of this report are not registered broker-dealers or financial advisors. Before investing in any securities, you should consult with your financial advisor and a registered broker-dealer. Never make an investment based solely on what you read in an online or printed report, including this report, especially if the investment involves a small, thinly-traded company that isn’t well known. Technical Traders Ltd. and the author of this report has been paid by Cardiff Energy Corp. In addition, the author owns shares of Cardiff Energy Corp. and would also benefit from volume and price appreciation of its stock. The information provided here within should not be construed as a financial analysis but rather as an advertisement. The author’s views and opinions regarding the companies featured in reports are his own views and are based on information that he has researched independently and has received, which the author assumes to be reliable. Technical Traders Ltd. and the author of this report do not guarantee the accuracy, completeness, or usefulness of any content of this report, nor its fitness for any particular purpose. Lastly, the author does not guarantee that any of the companies mentioned in the reports will perform as expected, and any comparisons made to other companies may not be valid or come into effect.
Chris Vermeulen Archive |
© 2005-2022 http://www.MarketOracle.co.uk - The Market Oracle is a FREE Daily Financial Markets Analysis & Forecasting online publication.