


This Stock Market Rally is Crazy, It Can’t Keep Going On!
Stock-Markets / Stock Markets 2019 Feb 05, 2019 - 04:06 PM GMTBy: Troy_Bombardia

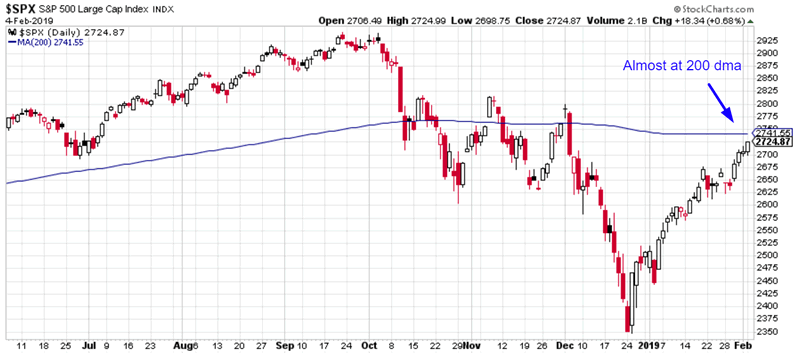
The S&P is now almost at its 200 day moving average. After a very rapid decline in December 2018, the stock market is making an equally rapid rally right now. Extremes happen in both directions.
This has been a V shaped recovery.
Go here to understand our fundamentals-driven long term outlook.
Let’s determine the stock market’s most probable medium term direction by objectively quantifying technical analysis. For reference, here’s the random probability of the U.S. stock market going up on any given day.

*Probability ≠ certainty. Past performance ≠ future performance. But if you don’t use the past as a guide, you are blindly “guessing” the future.
V shaped recovery
The stock market’s recovery has been V-shaped.
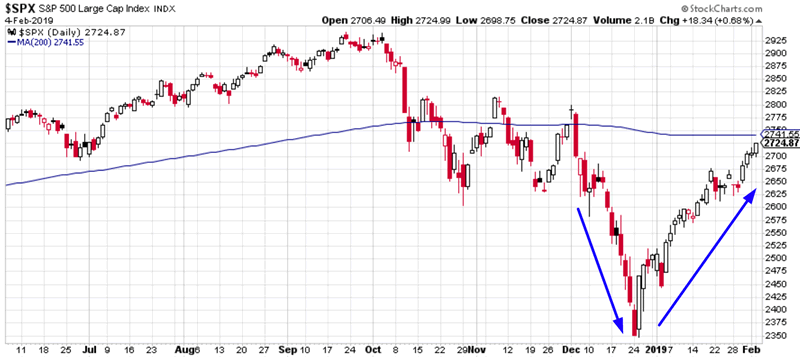
With the risk of sounding like a broken record, most of these V shaped recoveries are followed by a pullback/retest
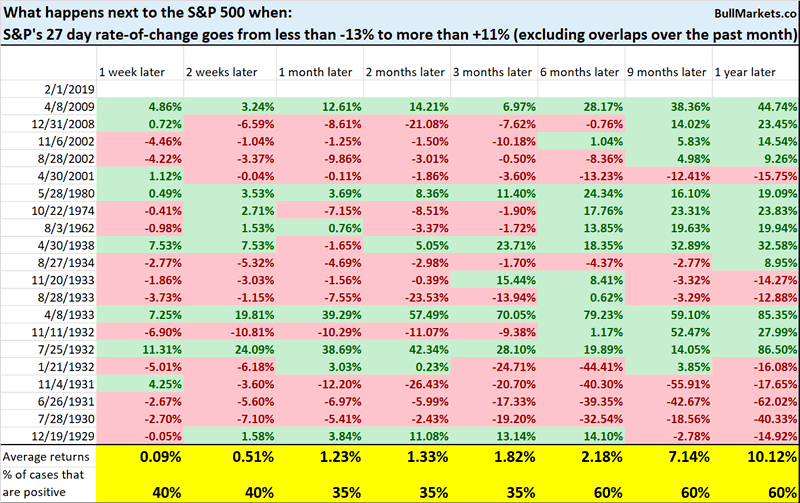
The S&P 500’s 27 day rate-of-change has gone from less than -13% to more than +11%.
Historically, this has been more bearish than bullish for stocks over the next 2-3 months
“This rally is crazy, it can’t keep going on!”
This is a line oft repeated by bears.
Yes, the rally is crazy.
Yes, it is likely that the stock market will make a short term pullback/retest.
However, not all “crazy rallies” are followed by a pullback or retest. Most are, but not all.
This is why we repeat “focus on the medium-long term, and mostly ignore the short term”.
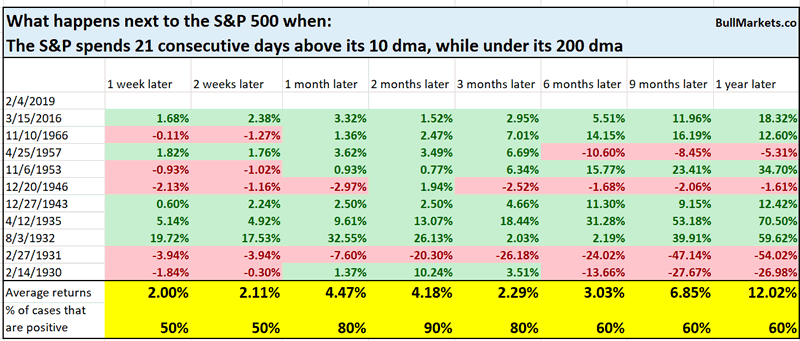
For example, the S&P has been above its 10 day moving average for 21 consecutive days, while still under its 200 day moving average.
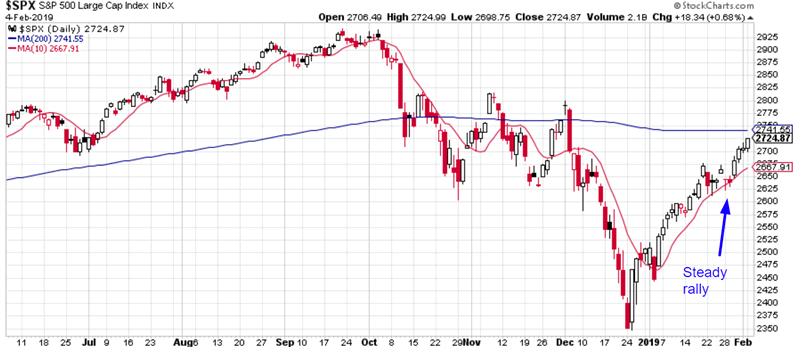
Historically, this has been bullish for the S&P 1-2 months later. Perhaps the S&P will come close to making an all time high before making a pullback retest, as we mentioned this weekend.
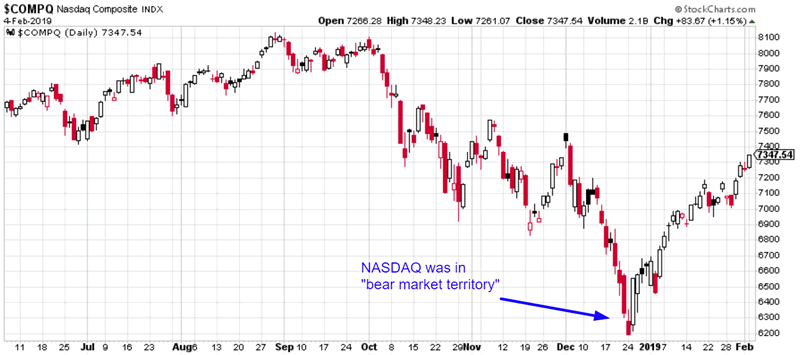
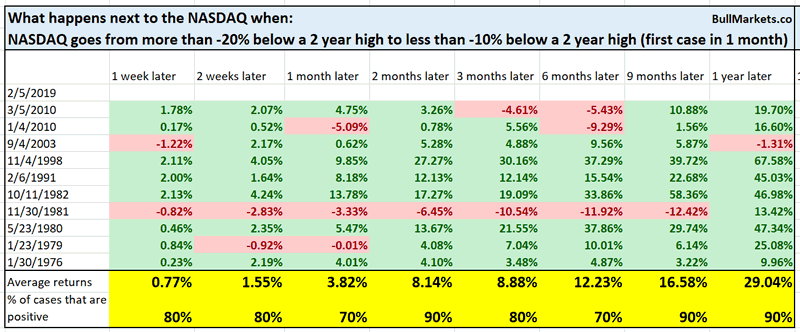
As per a popular Market Watch article, the NASDAQ has cleared away from “bear market territory” (define by the traditional -20% line).
The NASDAQ was more than -20% below a 2 year high, but is now less than -10% below a 2 year high
Historically, the NASDAQ’s 2 month and 1 year forward returns were remarkably bullish.
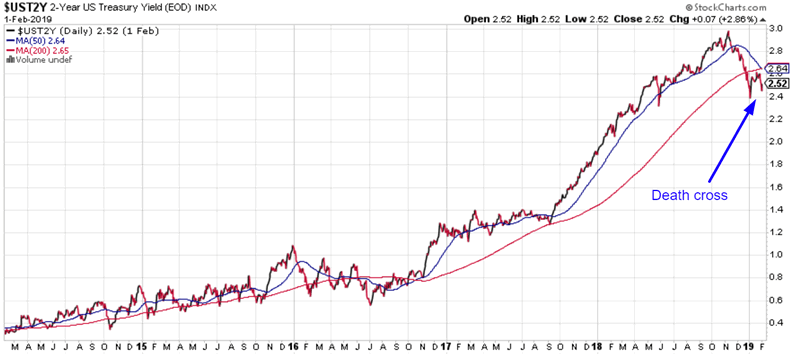
2 year Treasury yield
The 2 year Treasury yield made a “death cross”, whereby its 50 day moving average fell below its 200 day moving average.
While most traders are “worried about the Federal Reserve’s rate hikes”:
- Rate hikes are more bullish than bearish for stocks. The Fed hikes rates when the economy is improving, which is long term bullish for stocks
- Rate cuts are more bearish than bullish for stocks. The Fed cuts rates when the economy is deteriorating, which is long term bearish for stocks.
*The Fed reacts to the economy. The economy is the real determinate for long term stock prices.
Interest rates are falling right now, while the Unemployment Rate is creeping up. This is not a good combination.
Here’s what happens next to the S&P when the 2 year Treasury yield made a “death cross” while the Unemployment Rate is above its 12 month moving average.
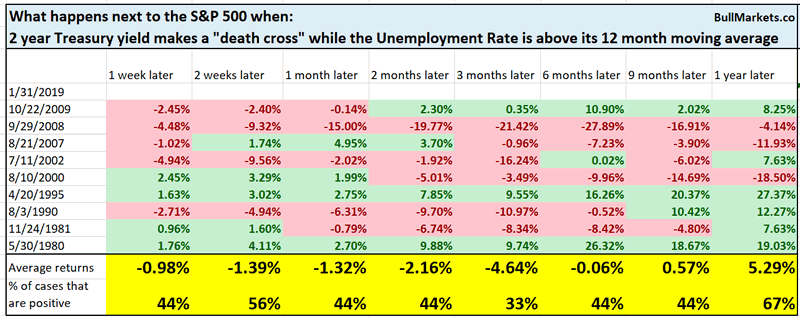
You can see that with the exception of 1995, all of these historical cases happened within the context of a bear market or economic recession.
Earnings season reactions
Here’s an interesting chart from Bespoke, which demonstrates that stocks have reacted positively to earnings reports this earnings season.
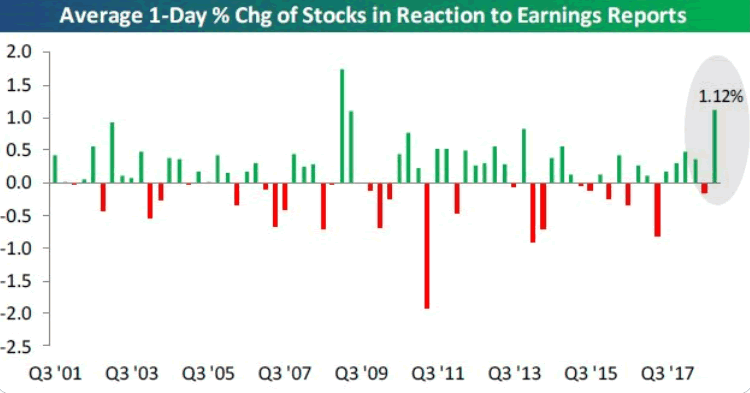
In fact, this is the most positive reaction since Q1 and Q2 2009, at the bottom of the 2007-2009 bear market.
On the surface this seems like a long term bullish sign for stocks, but I would like to see more historical data before jumping to any conclusions.
Baltic Dry Index
The Baltic Dry Index measures dry bulk shipping stocks. It is frequently used as a measurement for global shipping, an economic bellweather. (The common belief is that more shipping = improving global economy, less shipping = worsening global economy.)
The Baltic Dry Index has collapsed recently, reflecting the global economic slowdown. This global slowdown is much more pronounced outside the U.S. than within the U.S.
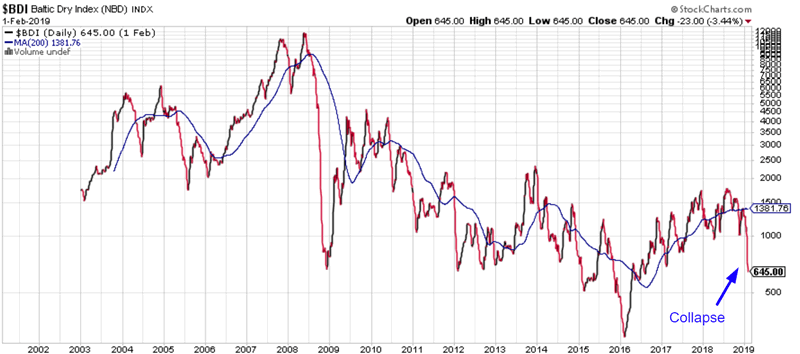
Is this a long term bearish sign for the stock market and economy?
Here’s what happens next to the S&P when the Baltic Dry Index is more than -50% below its 200 dma
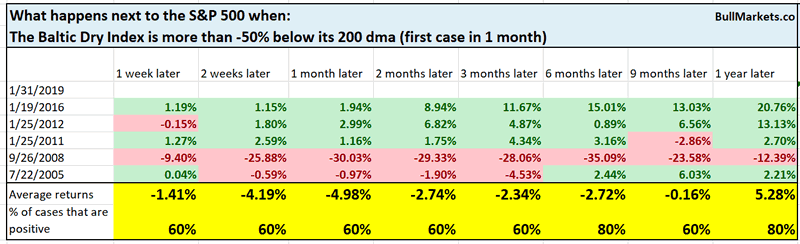
This is neither consistently bullish nor bearish for stocks.
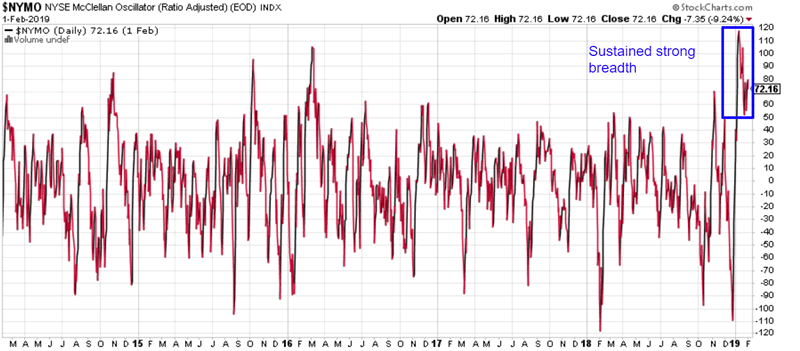
Extremely strong breadth
Breadth remains extremely strong thanks to the stock market’s nonstop rally. The NYSE McClellan Oscillator (a breadth indicator) remains above 50 for 21 consecutive days.
From 1998-present, this has never happened before.
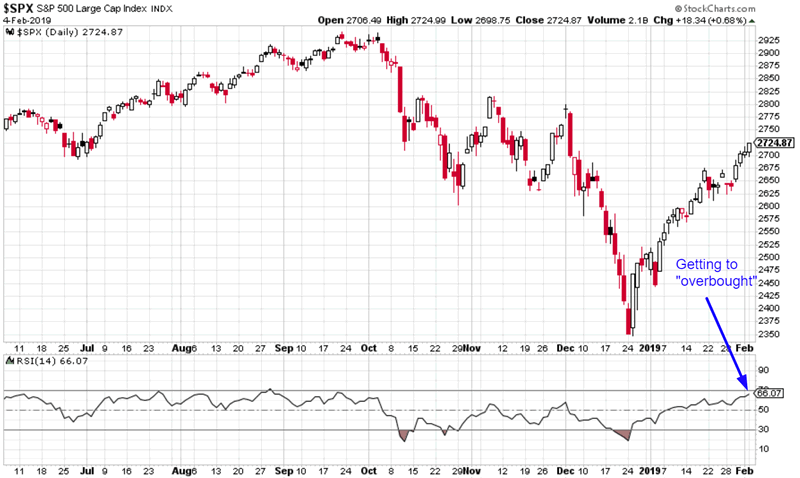
Overbought
The S&P 500’s 14 day RSI is approaching “overbought” territory for the first time in a long time. Is this bearish for stocks?
Here’s what happens next to the S&P 500 when its 14 day RSI exceeds 65 for the first time in 4 months
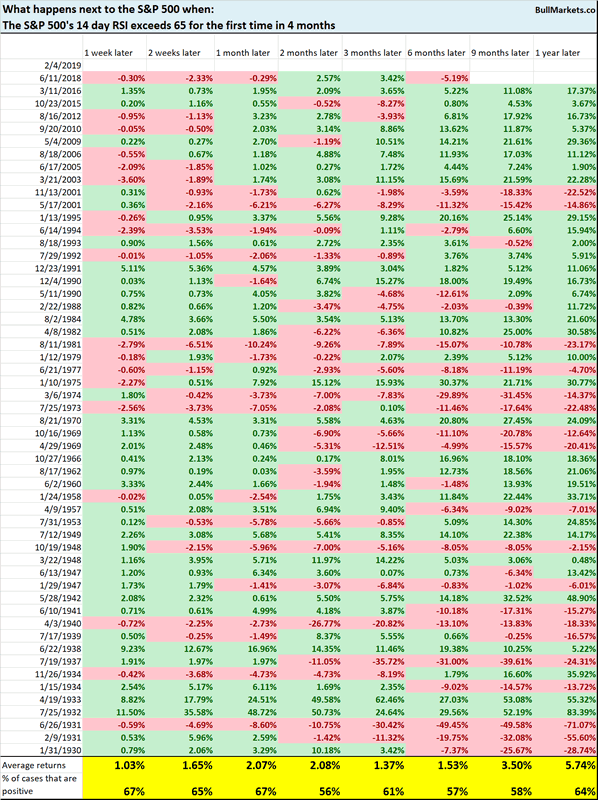
Neither consistently bullish nor bearish for stocks on any time frame.
Gold is also overbought
It’s not just the S&P that’s overbought. Gold is overbought as well. As of last Friday, gold’s RSI reached 70 for the first time in 2 years.
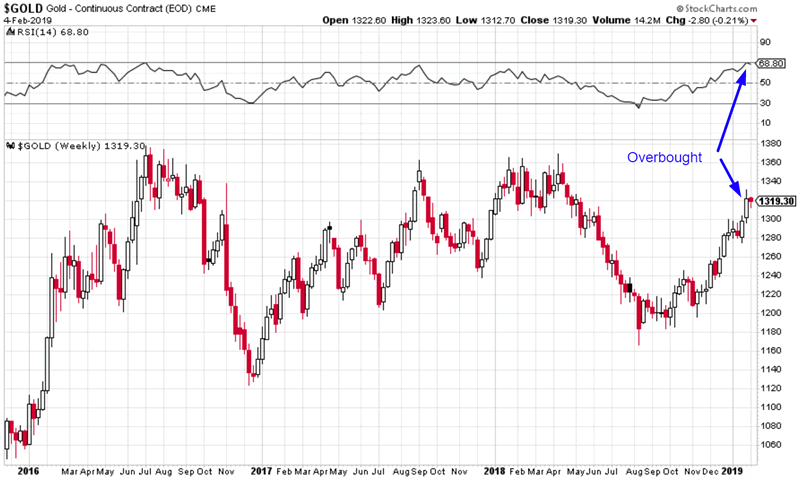
Here’s what happens next to gold when gold’s 14 weekly RSI exceeds 70 for the first time in 1 year
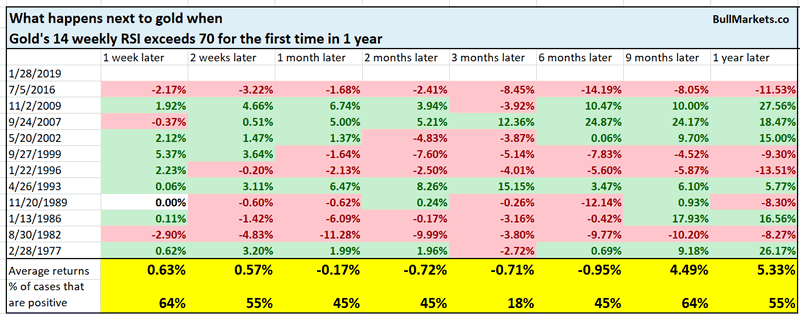
Gold’s forward returns over the next 3 months are bearish. Even if this is a new gold bull market, bull market’s don’t often go up in 1 straight line.
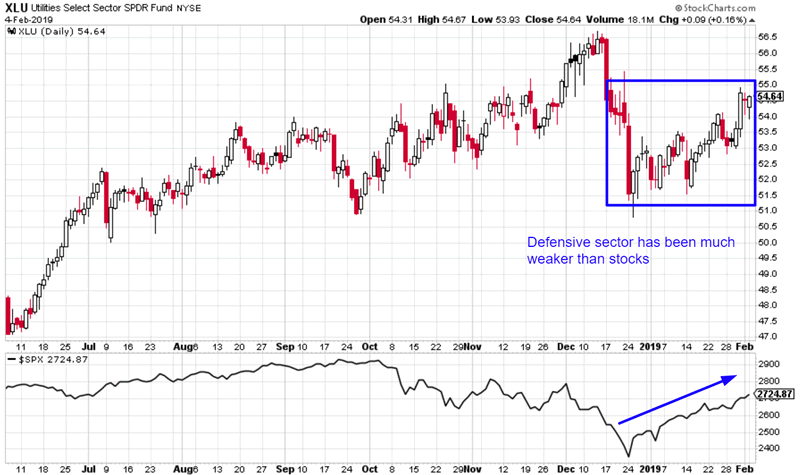
Defensive sector
We continue to monitor defensive sectors’ underperformance as the broad stock market rallies.
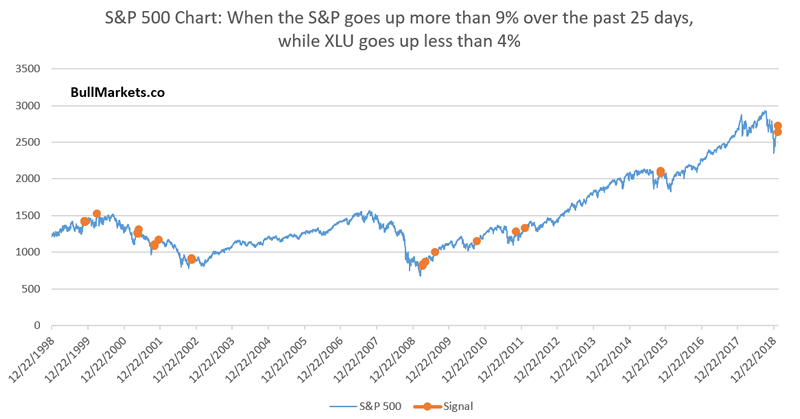
The S&P has gone up more than 9% of the past 25 days, while XLU has gone up less than 4%.
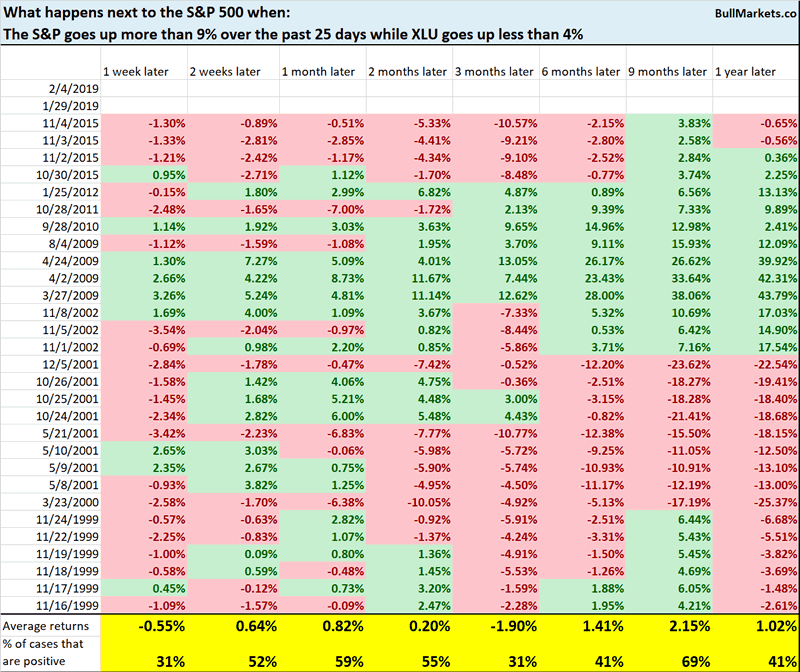
You can see that many of these historical cases are an overlap. But either way, this is the normal price action around 15%+ declines or bear markets.
Click here for yesterday’s market study
Conclusion
Here is our discretionary market outlook:
- The U.S. stock market’s long term risk:reward is no longer bullish. This doesn’t necessarily mean that the bull market is over. We’re merely talking about long term risk:reward. Long term risk:reward is more important than trying to predict exact tops and bottoms.
- The medium term direction (i.e. next 3-6 months) is neutral. Some market studies are medium term bullish while others are medium term bearish
- The stock market’s short term has a bearish lean due to the large probability of a pullback/retest. Focus on the medium-long term (and especially the long term) because the short term is extremely hard to predict.
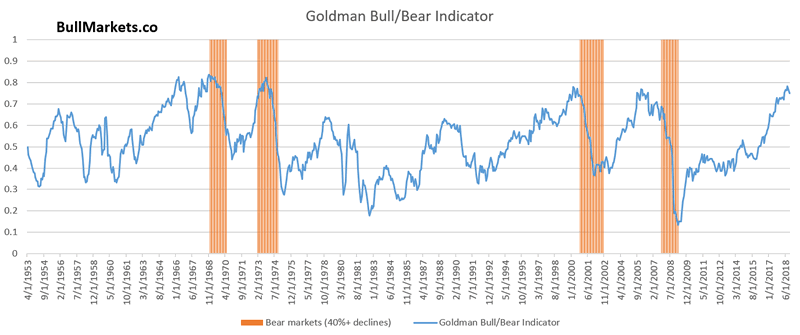
Goldman Sachs’ Bull/Bear Indicator demonstrates that while the bull market’s top isn’t necessarily in, risk:reward does favor long term bears.
Our discretionary outlook is not a reflection of how we’re trading the markets right now. We trade based on our clear, quantitative trading models, such as the Medium-Long Term Model.
Members can see exactly how we’re trading the U.S. stock market right now based on our trading models.
Click here for more market studies
By Troy Bombardia
I’m Troy Bombardia, the author behind BullMarkets.co. I used to run a hedge fund, but closed it due to a major health scare. I am now enjoying life and simply investing/trading my own account. I focus on long term performance and ignore short term performance.
Copyright 2019 © Troy Bombardia - All Rights Reserved
Disclaimer: The above is a matter of opinion provided for general information purposes only and is not intended as investment advice. Information and analysis above are derived from sources and utilising methods believed to be reliable, but we cannot accept responsibility for any losses you may incur as a result of this analysis. Individuals should consult with their personal financial advisors.
© 2005-2022 http://www.MarketOracle.co.uk - The Market Oracle is a FREE Daily Financial Markets Analysis & Forecasting online publication.