


Is The Stock Market Manic?
Stock-Markets / Financial Markets 2019 Feb 04, 2019 - 07:41 AM GMT

VIX challenged Long-term support at 16.39, closing beneath it on Friday. Primary Cycle [C] has been delayed another week. While investors are heaving a sigh of relief, the Wave structure and Cycles suggest a strong reversal may be imminent.
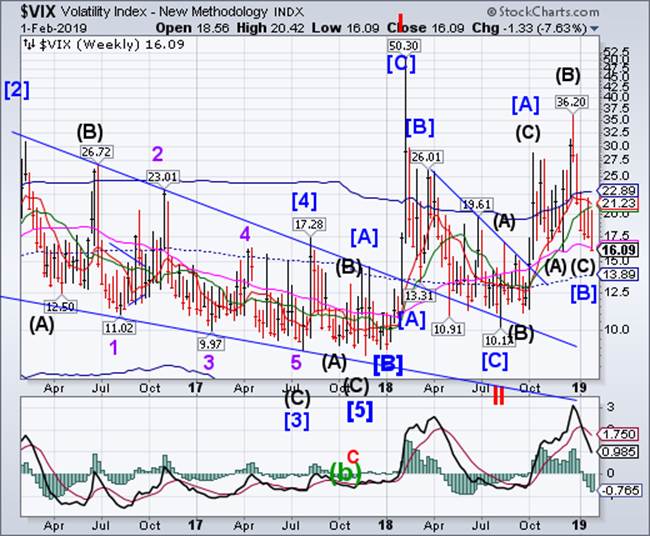
(Bloomberg) Two signposts of the global volatility complex suggest the risk rally is set to endure.
After a rare month in which implied swings for the S&P 500 Index exceeded those for emerging markets stocks, the relationship has flipped back to its historic norm. And after blowing out several times last year, the spread between volatility expectations on the Nasdaq and the S&P is drifting lower, too.
SPX stalls beneath Long-term resistance.
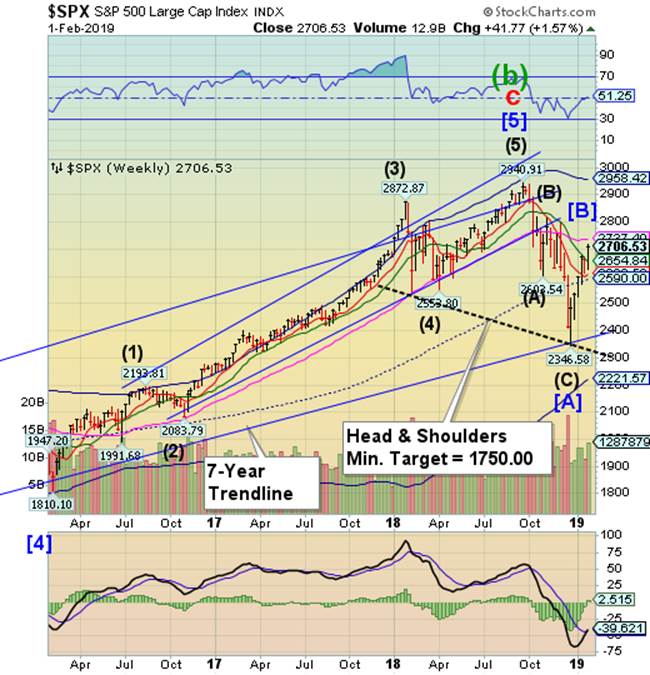
SPX rallied through Intermediate-term resustance at 2654.84, closing short of Long-term resistance at 2727.40. After 5 weeks of unbroken gains, the rally needs a rest. In this case it also appears that a retest of the December low must take place. There is a probable Head & Shoulders neckline that, if reached in the next few weeks, may indicate the target of this decline.
(Fortune) Despite trade wars and an historically long government shutdown, January was a banner month for stocks and the best in more than 30 years, the Wall Street Journal reported. That was after the worst December the markets had seen since the Great Depression.
The Dow Jones Industrial Average saw a rise of 7.2%, the best since January 1985. The S&P 500 was up 7.9%, which was the biggest start to a year since 1987. Nasdaq grew by 9.2%.
Pushing the gains were stocks of banks and smaller companies, both of which had taken a hit in December. The turnaround was helped in part by the Federal Reserve. Chairman Jerome Powell’s remarks in early January about more flexibility in interest rate increases and the body’s decision at the end of the month to leave interest rates where they had been boosted investor confidence.
NDX breaks through Intermediate-term resistance.
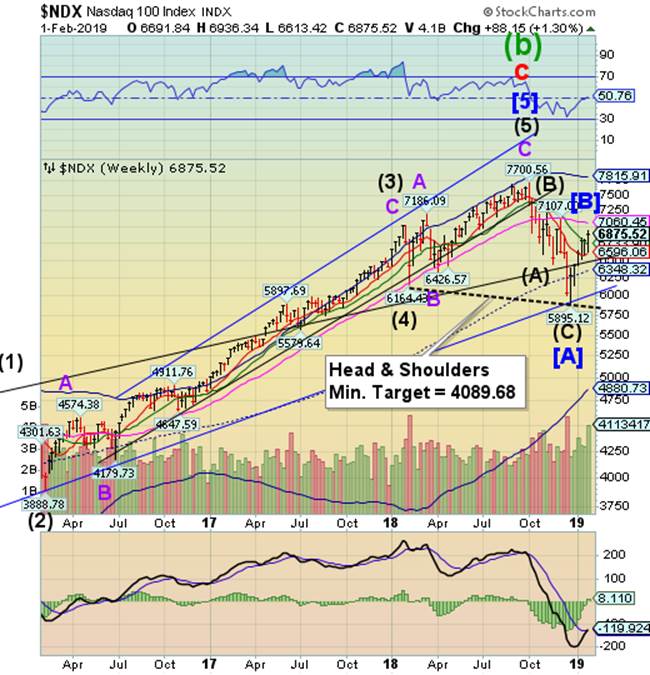
After two weeks beneath, NDX broke through Intermediate-term resistance at 6733.90, closing above it. The Cycles Model suggests that NDX is either at or very near the end of its rally. There is a potential Head & Shoulders formation that, if triggered, may erase up to 3 years of gains. Stay tuned!
(ZeroHedge) When the portfolio manager for the world's largest asset manager warns that, following a torrid market surge which saw virtually every major asset in January post positive returns, something which Deutsche Bank said had never before been seen, the market resembles a horror movie, it's probably a good idea to listen. Because that's just what BlackRock's Russ Koesterich has done in his latest blog post, asking "Have investors shifted market sentiment too quickly", and giving three specific reasons why that is indeed the case.
Here is Koesterich's take on why markets have gone from despair to euphoria in the blink of an eye, and why this signals that complacency is once again back.
High Yield Bond Index closes at a new retracement high.
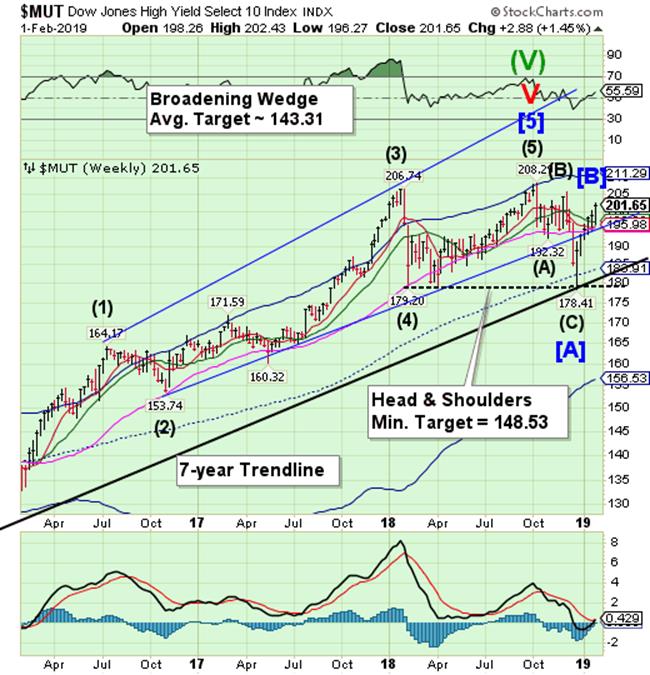
The High Yield Bond Index tested Intermediate-term support at 196.90 before closing over 200.00 for the week. The Broadening Wedge trendline at 195.00, if broken, may clear the way to a potential Head & Shoulders formation that may wipe out up to two years of gains.
(ZeroHedge) While credit spread and leveraged loan prices rebounded sharply in the past month, the pain for leveraged loan funds has continued with another $935 million in outflows in the week ended Jan. 30, extending the losing streak to 11 weeks. According to Lipper, $718 million was pulled from mutual funds and $216 million from ETFs. In total, investors have pulled $3.15 billion from the funds year-to-date.
This week’s exodus is the latest in a string of outflows for leveraged loan funds which started in mid-November, and which included four of the biggest weekly withdrawals on record. The 11 week stretch of outflows is the longest such streak since 2017 according to Bloomberg data.
Treasury bonds test mid-Cycle resistance.
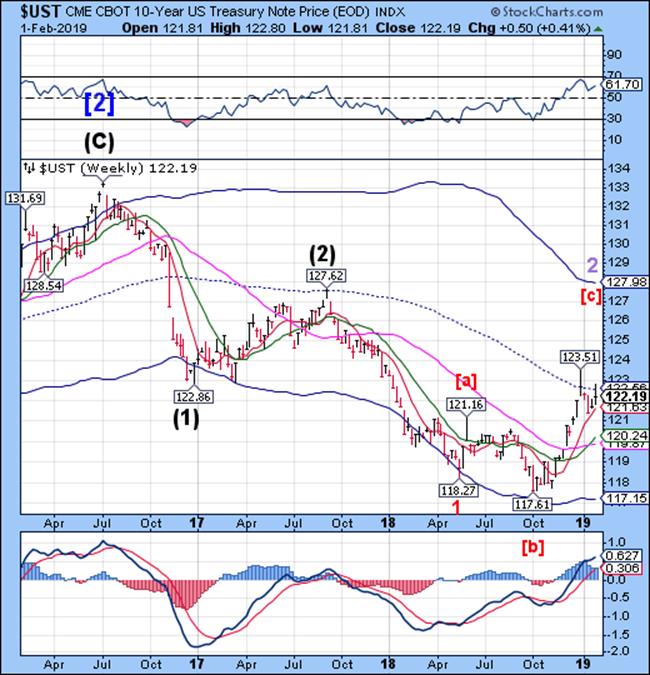
The 10-year Treasury Note Index challenged the mid-Cycle resistance at 122.56 then pulled back. The breakout above mid-Cycle resistance now gives us the potential direction of the move in the next two weeks.
(MarketWatch) Treasury prices extended their rally early Thursday, dragging down yields, as bullish investors took comfort in the outcome of a Federal Reserve meeting that signaled a pause in rate hikes.
The 10-year Treasury note yield TMUBMUSD10Y, +2.09% tumbled 6.3 basis points to 2.631%, its lowest since Jan. 3, contributing to a monthlong drop of 5.3 basis points. The 2-year note yield TMUBMUSD02Y, +1.80% slipped 6.6 basis points to 2.458%, leading to a 3.8 basis point drop in January.
The 30-year bond yield TMUBMUSD30Y, +0.96% fell 4.9 basis points to 3.003%, leaving it down 1.7 basis points for the month. All three maturities posted their biggest one-day drop since Jan. 3. Bond prices move in the opposite direction of yields.
The Euro challenges resistance again.
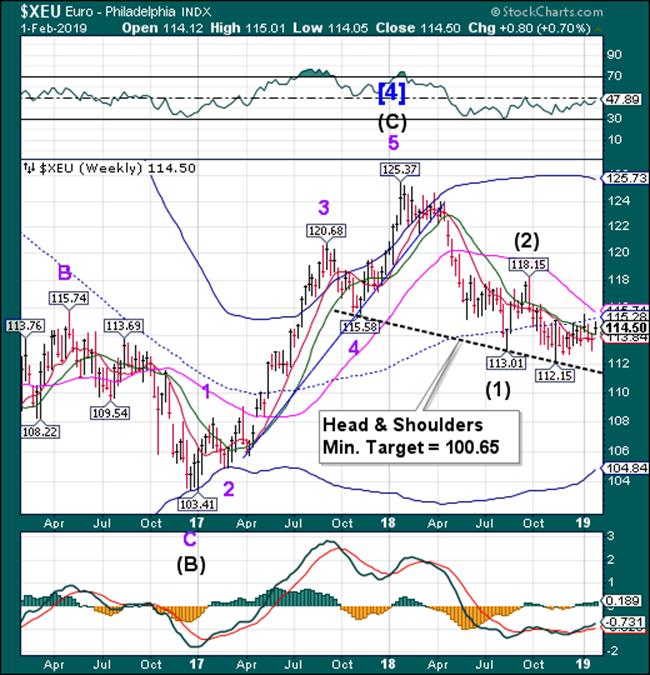
The Euro challenged Intermediate-term resistance again, but may have a similar result as in the past. There is a potential Head & Shoulders formation beneath 112.00 that suggests a downside target that may be attained in the next month.
(Bloomberg) The euro’s area’s inflation rate declined further at the start of the year, though there was a small pickup in an underlying measure.
The headline rate fell to 1.4 percent in January, in line with the median estimate of economists, though still the weakest since April. Core inflation rose to 1.1 percent, the highest in three months.
The 19-country bloc is in the throes of a slowdown that has the potential to delay ECB policy tightening or even prompt a fresh injection of stimulus. With domestic political tensions and the U.S.-China trade dispute weighing on sentiment, the economy finished off last year with only a meager rise in output.
EuroStoxx losing momentum.
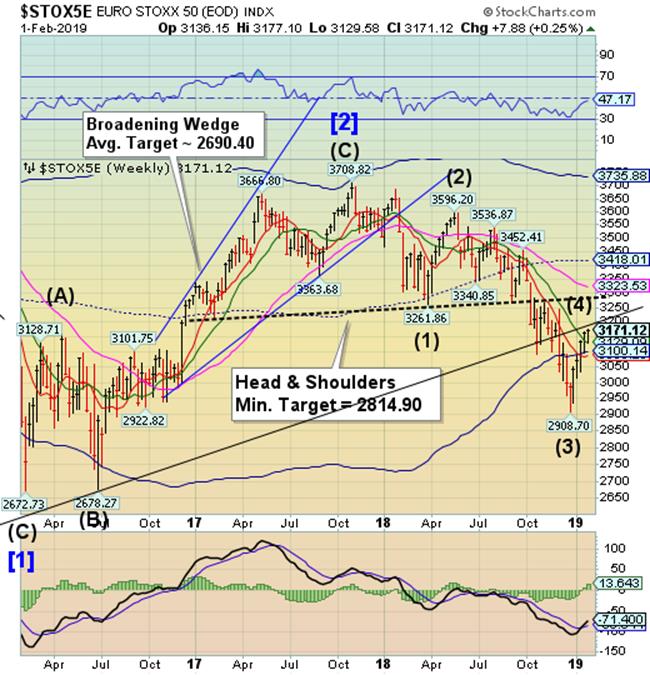
EuroStoxx declined to Intermediate-term support at 3129.09 where it bounced. The loss of Cyclical strength is apparent, but the reversal hasn’t happened yet. EuroStoxx may have made its Master Cycle high on Thursday.
(Reuters) - Investors piled into bonds in the past week and pulled billions of dollars from U.S. and European stocks as they sought safety in assets seen as less risky in times of economic uncertainty, Bank of America Merrill Lynch (BAML) said on Friday.
The bank’s report, based on EPFR data which tracks fund flows from Wednesday to Wednesday, showed investors yanked $15 billion from equities in the week to Jan. 30, the tenth outflow of the past 11 weeks.
Some $15.2 billion was pulled from U.S. stocks and $3.7 billion from Europe, marking the 46th weekly outflow of the past 47 weeks from the region.
.The Yen probes higher.
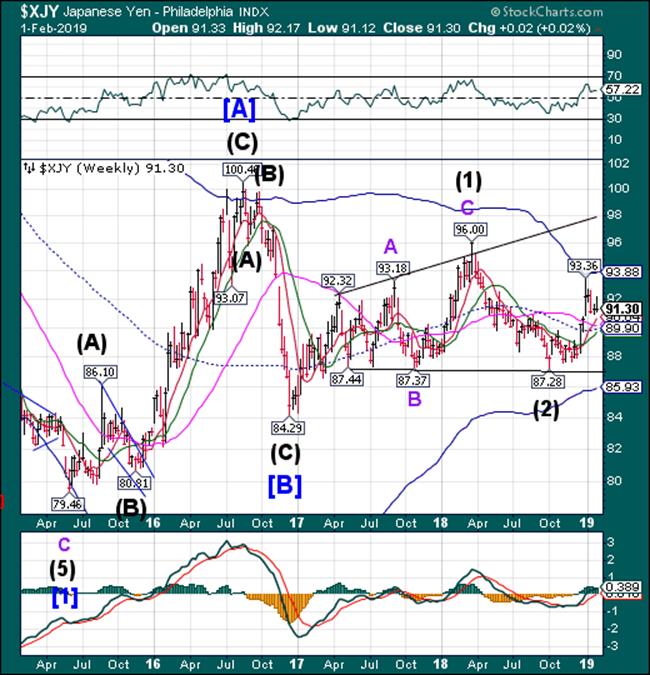
The Yen probed higher as it gathers strength for the next upswing, but closed flat for the week. The Cycles Model suggests a continued probe to the upper trendline over the next two weeks
Nikkei overcomes Short-term resistance.
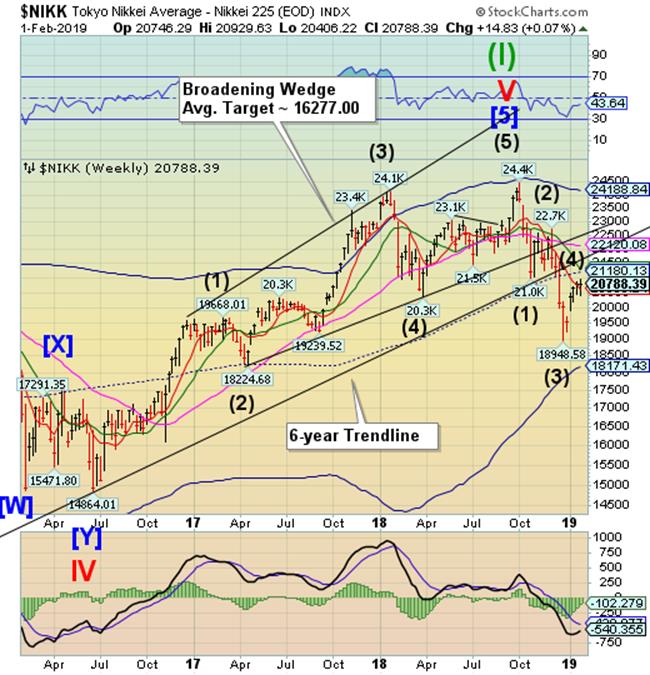
The Nikkei consolidated around Short-term resistance at 20598.24, closing above it a second time. The Cycles Model suggests an inversion (high) sometime next week, leading to a reversal. The bounce may be running out of time.
(JapanTimes) The benchmark Nikkei average closed marginally higher on the Tokyo Stock Exchange Friday, as investors weighed mixed results from a slew of major Japanese companies amid the earnings reporting season.
The 225-issue Nikkei average gained 14.90 points, or 0.07 percent, to end at 20,788.39, after rising 216.95 points on Thursday.
But the Topix index of all first-section issues closed down 2.86 points, or 0.18 percent, at 1,564.63. It gained 16.73 points the previous day.
U.S. Dollar stalls at mid-Cycle support.
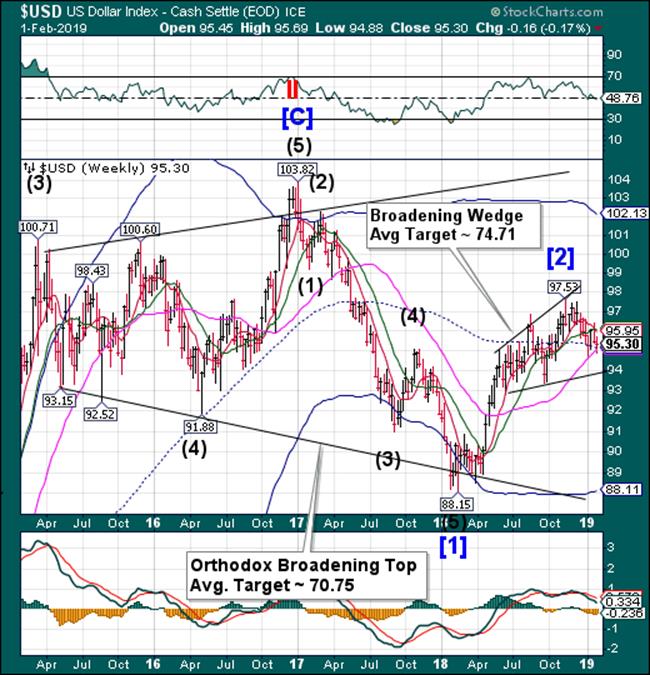
USD challenged Short-term support and mid-Cycle support at 95.12, but closed above both. The USD remains on a sell signal. The Cycles Model suggests weakness for the next 2 weeks or more.
(Reuters) - The dollar fell against most major currencies on Thursday, dropping to a two-week low versus the yen, pressured by the Federal Reserve's cautious U.S. economic outlook suggesting the central bank is near the end of its tightening cycle.
The Fed's dovish stance in Wednesday's policy statement took the market by surprise even though it has preached patience and balance sheet flexibility for some time. Analysts said the
statement felt like the Fed did a turn around from its previous generally upbeat stance.
Over the last two months, the dollar index, which tracks the currency versus six major rivals, has fallen around 2.0 percent, on track for its worst two-month performance in a year.
Gold attains its target.
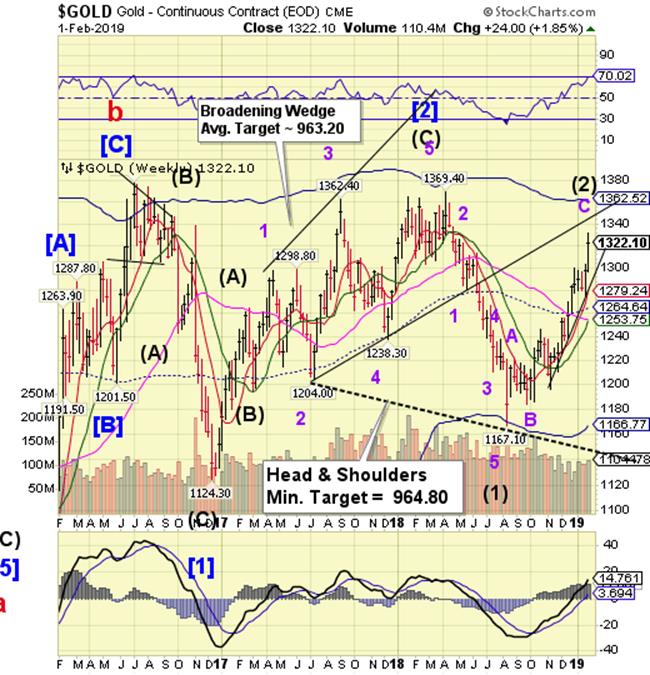
Gold soared to 1331.10 on Thursday, exceeding its target mentioned last week. It may have also attained its Master Cycle high, anticipated in the Cycles Model. While it may have another day or two near the top, once it reverses, watch out below.
(Reuters) - Gold steadied on Friday after hitting a nine-month peak in the previous session, as the market awaited U.S. jobs data for indications on the strength of the world’s biggest economy.
A more dovish U.S. Federal Reserve outlook and a weaker dollar had lifted gold on Thursday, although it later steadied as optimism about U.S.-China trade talks lifted appetite for riskier assets.
Still, the precious metal remained on track for its second straight weekly gain and weak Chinese factory data lent support.
Crude rally may wind down.
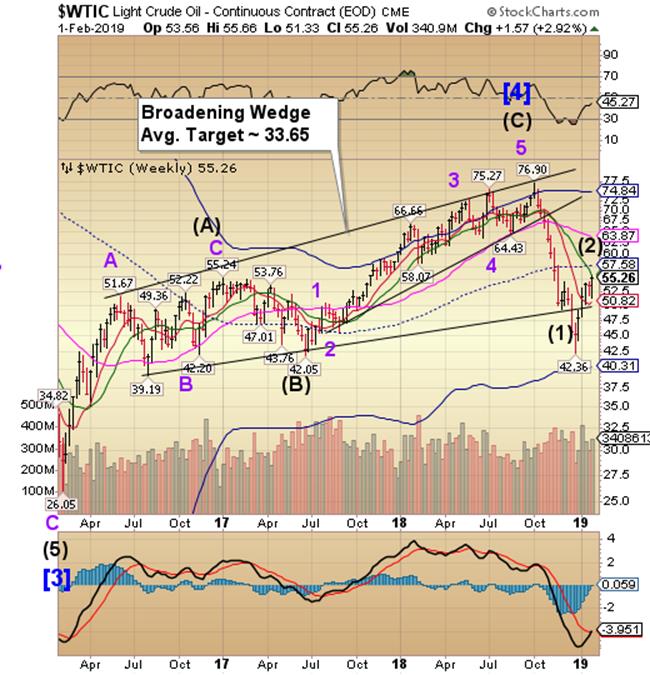
Crude oil rallied yet another week in an irregular correction, as suggested by the Cycles Model. However, it stalled at Intermediate-term resistance at 55.70. That may prove fatal to the rally as it winds down next week.
(RigZone) Bullish factors tied to political instability in Venezuela and curbs on production by OPEC members spurred on West Texas Intermediate (WTI) and Brent crude oil futures Friday.
The March WTI contract gained $1.47 Friday, settling at $55.26 per barrel. The benchmark traded within a range from $53.37 to $55.66. Against the Jan. 25 settlement price, the WTI is up 2.9 percent for the week. Brent crude oil for April delivery rose by $1.91 to end the day at $62.75. For the week, the Brent is up 1.8 percent.
“After several range-bound trading days, WTI and Brent both moved higher to levels not seen in about six weeks, largely on ‘bullish’ fundamentals,” said Tom Seng, Assistant Professor of Energy Business with the Collins College of Business at the University of Tulsa. “Concerns over the volatile situation in Venezuela continued into this week as several nations chose sides in the political struggle there. The Trump administration this week officially placed a ban in the importation of oil from PDVSA which amounts to about 500,000 barrels per day (bpd).”
Shanghai Index rises above Intermediate-term resistance.
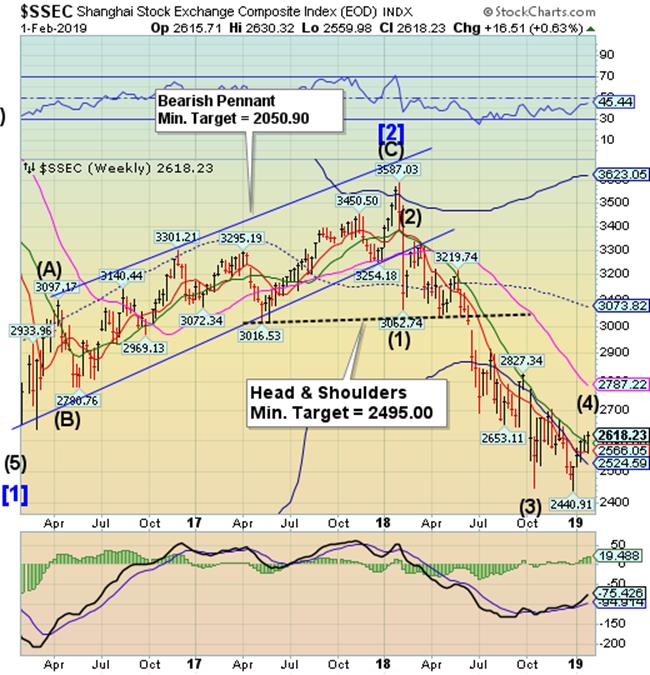
The Shanghai Index may have hit its peak on Monday as it closes above Intermediate-term support at 2586.64. A period of strength ended this week. It may resume its decline with a potential bottom near 2000.00-2200.00.
(ZeroHedge) The country’s economic problems are starting to escalate...
China is a country of extremes, especially regarding economic forecasts. There are those who think “China will take over the world” with its technocratic central planning. Then there are those who say its debt bubble is so gigantic, the economy will crash and burn.
The truth, probably, lies somewhere in the middle. And it looks like we are getting closer to know the truth.
Official GDP growth, is of course on track at 6.6 percent for the year 2018, stellar among industrial and even emerging economies. But nobody believes these figures, even though they are the worst since 1990.
“Real GDP fell by 1.7 percent and 0.6 percent in Q3 and Q4 respectively compared with the official figures showing growth of 6.4 percent and 6 percent,” Enodo Economics chief economist Diana Choyleva wrote in a note to clients about the annualized growth during the past two quarters of 2018.
The Banking Index posts its first weekly loss of the year.
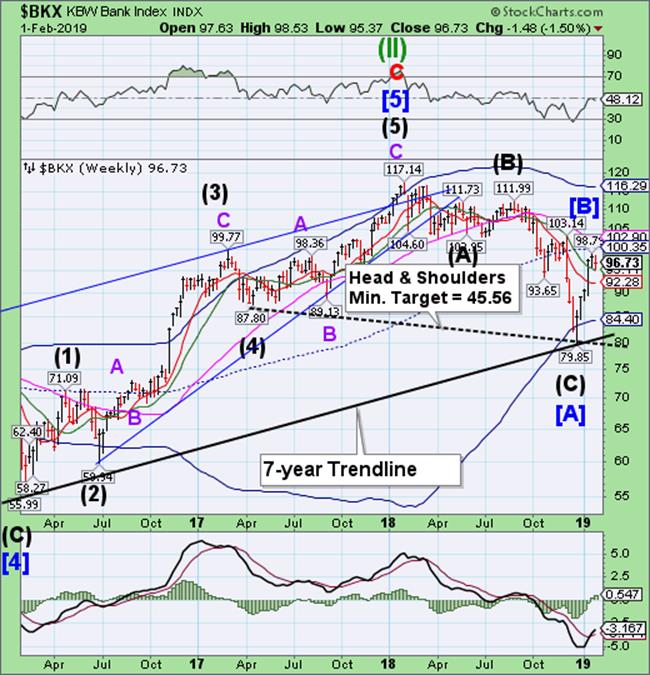
-- BKX posted a loss for the week, which may be the first of many. The Liquidity Model turned negative last weekend, so the “good news” from the Fed had no impact on the banking sector. The Cycles Model suggests the decline may resume the retest of the December low over the next 2 weeks. The structure may then become more bearish.
(Reuters) - The European Union’s antitrust authority has charged eight unnamed banks with operating a cartel in trading euro zone government bonds between 2007 and 2012, years when the financial crisis dragged down banks and countries.
The European Commission said in a statement that some traders at the banks exchanged commercially sensitive information and coordinated trading strategies on the euro-denominated bonds, mainly through online chatrooms.
The move by the European Commission’s powerful antitrust arm is the latest blow to the public image of Europe’s banks, which have paid out billions of euros in fines, including for rigging interest rate benchmarks used to price home loans.
(Bloomberg) At this point, Deutsche Bank AG’s biggest problem may simply be how many problems it has, how long they’ve gone on and how they’ve fueled one another. Four years of sliding revenue has spawned four failed turnaround plans and the steady departure of senior executives. That’s alongside an equally steady stream of lawsuits and investigations, topped by a raid on the bank’s headquarters in November. Its next obstacle may be the solution the German government seems to have in mind -- merging it with its troubled cross-town rival, Commerzbank AG.
1. What’s gone wrong?
Chief Financial Officer James von Moltke has said the bank is suffering from “a vicious circle of declining revenues, sticky expenses, lowered ratings and rising funding costs.” It’s repeatedly tried to reverse the slide, without success. Problems include outdated technology, a talent drain and heavy fines -- $17 billion in the last decade -- for misconduct. Adverse market conditions, which limited opportunities to profit from trading, and a credit-rating downgrade have compounded the homemade difficulties. The bank’s shares lost more than half their value in 2018.
(ZeroHedge) Since the Wall Street Journal first exposed the fraud at Malaysian sovereign wealth fund 1MDB back in 2015, Goldman and CEO David Solomon have been denying that the bank's role in enabling the perpetrators of the multibillion dollar public swindle, a group that included a corrupt banker and former Prime Minister Najib Razak, was the result of a few bad apples - not the result of a "culture of corruption", as former Goldman banker-turned-cooperating-government-witness Tim Leissner alleged in an affidavit.
All the best!
Tony
Our Investment Advisor Registration is on the Web.
We are in the process of updating our website at http://mrpracticalinvestor.com/ to have more information on our services. Log on and click on Advisor Registration to get more details.
If you are a client or wish to become one, please make an appointment to discuss our investment strategies by calling Connie or Tony at (517) 699-1554, ext 10 or 11. Or e-mail us at tpi@thepracticalinve4stor.com .
Anthony M. Cherniawski, President and CIOhttp://mrpracticalinvestor.com
As a State Registered Investment Advisor, The Practical Investor (TPI) manages private client investment portfolios using a proprietary investment strategy created by Chief Investment Officer Tony Cherniawski. Throughout 2000-01, when many investors felt the pain of double digit market losses, TPI successfully navigated the choppy investment waters, creating a profit for our private investment clients. With a focus on preserving assets and capitalizing on opportunities, TPI clients benefited greatly from the TPI strategies, allowing them to stay on track with their life goals.
Disclaimer: The content in this article is written for educational and informational purposes only. There is no offer or recommendation to buy or sell any security and no information contained here should be interpreted or construed as investment advice. Do you own due diligence as the information in this article is the opinion of Anthony M. Cherniawski and subject to change without notice.
Anthony M. Cherniawski Archive |
© 2005-2022 http://www.MarketOracle.co.uk - The Market Oracle is a FREE Daily Financial Markets Analysis & Forecasting online publication.