Most Popular
1. Banking Crisis is Stocks Bull Market Buying Opportunity - Nadeem_Walayat
2.The Crypto Signal for the Precious Metals Market - P_Radomski_CFA
3. One Possible Outcome to a New World Order - Raymond_Matison
4.Nvidia Blow Off Top - Flying High like the Phoenix too Close to the Sun - Nadeem_Walayat
5. Apple AAPL Stock Trend and Earnings Analysis - Nadeem_Walayat
6.AI, Stocks, and Gold Stocks – Connected After All - P_Radomski_CFA
7.Stock Market CHEAT SHEET - - Nadeem_Walayat
8.US Debt Ceiling Crisis Smoke and Mirrors Circus - Nadeem_Walayat
9.Silver Price May Explode - Avi_Gilburt
10.More US Banks Could Collapse -- A Lot More- EWI
Last 7 days
Stock Market Volatility (VIX) - 25th Mar 24
Stock Market Investor Sentiment - 25th Mar 24
The Federal Reserve Didn't Do Anything But It Had Plenty to Say - 25th Mar 24
Stock Market Breadth - 24th Mar 24
Stock Market Margin Debt Indicator - 24th Mar 24
It’s Easy to Scream Stocks Bubble! - 24th Mar 24
Stocks: What to Make of All This Insider Selling- 24th Mar 24
Money Supply Continues To Fall, Economy Worsens – Investors Don’t Care - 24th Mar 24
Get an Edge in the Crypto Market with Order Flow - 24th Mar 24
US Presidential Election Cycle and Recessions - 18th Mar 24
US Recession Already Happened in 2022! - 18th Mar 24
AI can now remember everything you say - 18th Mar 24
Bitcoin Crypto Mania 2024 - MicroStrategy MSTR Blow off Top! - 14th Mar 24
Bitcoin Gravy Train Trend Forecast 2024 - 11th Mar 24
Gold and the Long-Term Inflation Cycle - 11th Mar 24
Fed’s Next Intertest Rate Move might not align with popular consensus - 11th Mar 24
Two Reasons The Fed Manipulates Interest Rates - 11th Mar 24
US Dollar Trend 2024 - 9th Mar 2024
The Bond Trade and Interest Rates - 9th Mar 2024
Investors Don’t Believe the Gold Rally, Still Prefer General Stocks - 9th Mar 2024
Paper Gold Vs. Real Gold: It's Important to Know the Difference - 9th Mar 2024
Stocks: What This "Record Extreme" Indicator May Be Signaling - 9th Mar 2024
My 3 Favorite Trade Setups - Elliott Wave Course - 9th Mar 2024
Bitcoin Crypto Bubble Mania! - 4th Mar 2024
US Interest Rates - When WIll the Fed Pivot - 1st Mar 2024
S&P Stock Market Real Earnings Yield - 29th Feb 2024
US Unemployment is a Fake Statistic - 29th Feb 2024
U.S. financial market’s “Weimar phase” impact to your fiat and digital assets - 29th Feb 2024
What a Breakdown in Silver Mining Stocks! What an Opportunity! - 29th Feb 2024
Why AI will Soon become SA - Synthetic Intelligence - The Machine Learning Megatrend - 29th Feb 2024
Keep Calm and Carry on Buying Quantum AI Tech Stocks - 19th Feb 24

Market Oracle FREE Newsletter

How to Protect your Wealth by Investing in AI Tech Stocks

Saudi Stock Market (Tadawul) at pivotal juncture

Stock-Markets / Saudi Arabia Jan 28, 2019 - 03:45 PM GMT

By: MarketsToday

Stock-Markets

As of yesterday’s (Sunday) 8,528.30 trend high, the Tadawul All Share Index (TASI) has rocketed over 12% in 25 trading days, when counting from the swing low of 7,589.23 on December 23. A long-term bullish trend continuation signal was triggered on the move as the day’s close was at 8,509.43, just above the most recent peak of 8,502.92 from July 2018. Further, yesterday’s close was the highest daily closing price since August 2015.
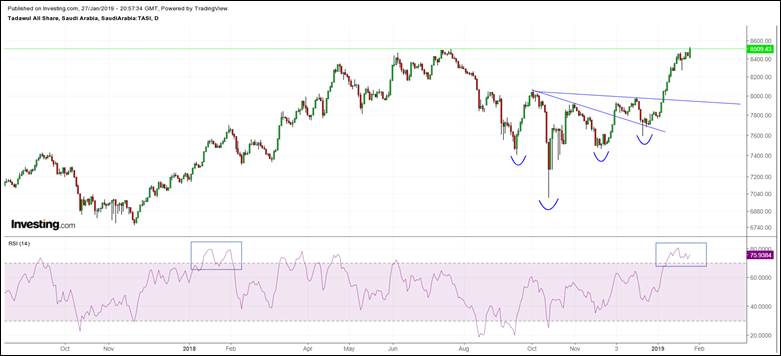

TASI Daily Chart

During the rally, the index broke out of a head and shoulders bottom trend reversal pattern with a complex right shoulder. You can see from the chart below that there was first a breakout of a head & shoulders bottom as price went through the lower neckline in early-December. Then, the formation continued to evolve, creating a second right shoulder. This led to a breakout of the second neckline three weeks ago. Given that yesterday’s high was just barely above the July peak, it remains to be seen if some resistance may still be seen before the TASI continues higher.

This is all very bullish behavior. Nevertheless, the TASI may have gotten ahead of itself and needs to take at least a short rest before moving higher. Given the rapid ascent over the past five weeks and the fact that the index is hitting potentially significant resistance, it seems like there is a good chance for some sideways movement or a pullback before the TASI is ready to sustain upward momentum. Also, the 14-day Relative Strength Index (RSI) momentum oscillator is well overbought at this point.
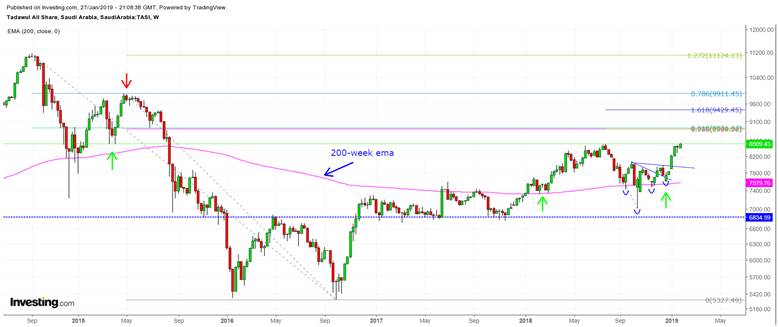

TASI Weekly Chart

Either way, it would be healthy for the advance if the index took a bit of a rest before progressing. This would also give investors a chance to prepare for the next run, as a continuation of the long-term uptrend that began off the October 2016 low. Regardless, so far there is no sign that the TASI will stall or pullback in a more significant fashion than last week’s relatively sideways movement. Investors should be prepared, nevertheless.

Investors in US markets can get exposure to Saudi equities through at least two ETFs. The iShares MSCI Saudi Arabia ETF (KSA) has almost 100% exposure to the Tadawul, while the Wisdom Tree Middle East Dividend Fund (GULF) has approximately 27% exposure, according to ETF Database.


© 2005-2022 http://www.MarketOracle.co.uk - The Market Oracle is a FREE Daily Financial Markets Analysis & Forecasting online publication.


Post Comment

Only logged in users are allowed to post comments. Register/ Log in