


Dubai Stock Market Faces Potential Bullish Reversal
Stock-Markets / Dubai Jan 26, 2019 - 05:39 PM GMTBy: MarketsToday

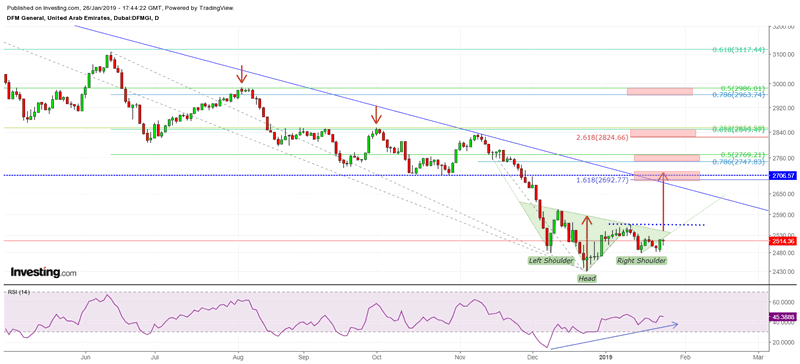
DFMGI
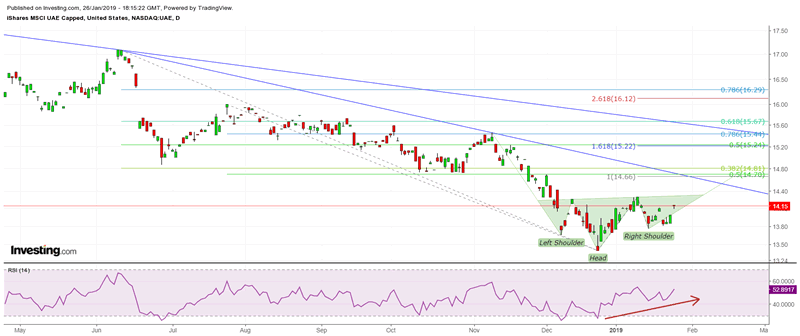
- Potential inverse head & shoulders bullish reversal setup in the daily chart for the Dubai Financial Market General Index (DFMGI). (Exposure can also be accessed via iShares MSCI UAE ETF (UAE), traded in the U.S. Although average volume is relatively low.)
- Pattern occurs off December 2,429.12 low, which completed a 34% 14-month decline from the October 2017 swing high.
- Bullish 14-day RSI divergence.
- Breakout triggered on decisive move above 2,561.
- Minimum target objective of approximately 2,716.80 as derived from the head & shoulders pattern (previously support zone from October 2018 & in area of 1.618 Fibonacci projection).
- Other potential targets are highlighted on the below chart and derived from prior price and Fibonacci confluence levels.
- Current pattern is invalid on a daily close below the right shoulder at 2,479.37.
- Potential head & shoulders bottom setting up.
- Breakout occurs on decisive rally above the most recent swing high of $14.30.
- Minimum target objective from the pattern of $15.16.
- UAE ETF includes a mix of UAE stocks, not just Dubai exchange traded, but also Abu Dhabi & UK exchanges.
- Pattern is invalid on a daily close below the right shoulder of $13.76.
Bruce Powers, CMT
Chief Technical Analyst
http://www.marketstoday.net/
© 2018 Copyright Bruce Powers- All Rights Reserved
Disclaimer: The above is a matter of opinion provided for general information purposes only and is not intended as investment advice. Information and analysis above are derived from sources and utilising methods believed to be reliable, but we cannot accept responsibility for any losses you may incur as a result of this analysis. Individuals should consult with their personal financial advisors.
© 2005-2022 http://www.MarketOracle.co.uk - The Market Oracle is a FREE Daily Financial Markets Analysis & Forecasting online publication.