


After the Crash, the Stock Market Made a V-shaped Recovery. What’s Next
Stock-Markets / Stock Markets 2019 Jan 19, 2019 - 01:55 PM GMTBy: Troy_Bombardia

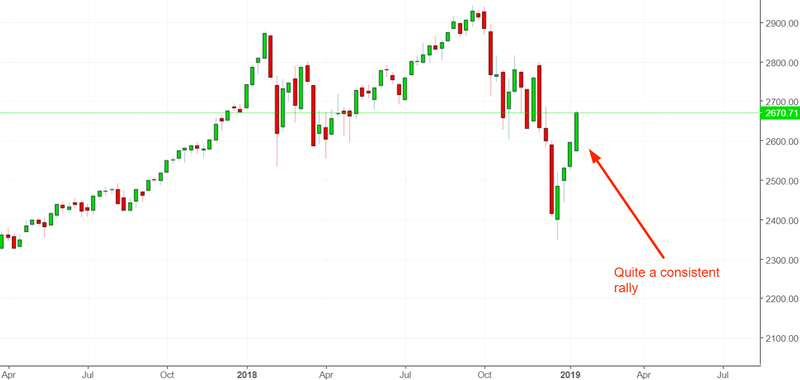
The S&P has now retraced more than 50%, which was the standard post-crash target outlined a few weeks ago. The stock market is exactly where it was a few months ago. This demonstrates the stock market’s “bullish bias” – it goes up more often than down. Absent significant macro economic deterioration, it’s very hard for the stock market to keep going down.
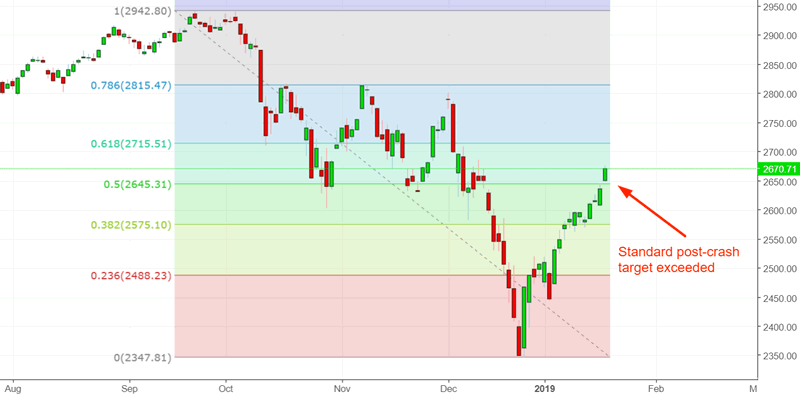
Source: Investing.com
The economy’s fundamentals determine the stock market’s medium-long term outlook. Technicals determine the stock market’s short-medium term outlook. Here’s why:
- The stock market’s long term risk:reward is no longer bullish.
- The stock market’s medium term is mostly neutral (i.e. next 3-6 months)
- The stock market’s short term has a slight bearish lean.
We focus on the long term and the medium term. Let’s go from the long term, to the medium term, to the short term.
Long Term
While the bull market could very well keep going on, the long term risk:reward no longer favors bulls. Past a certain point, risk:reward is more important than the stock market’s most probable long term direction.
*”Bear markets” = 33%+ declines that last >1 year. E.g. 2007-2009, 2000-2002, 1973-1974, 1968-1970.
Some leading indicators are showing signs of deterioration. The usual chain of events looks like this:
- Housing – the earliest leading indicators – starts to deteriorate. This has occurred already
- The labor market starts to deteriorate. Meanwhile, the U.S. stock market is in a long term topping process. We are here right now.
- The labor market deteriorates some more, while other economic indicators start to deteriorate. The bull market is definitely over.
We are currently at the start of Phase 2. Let’s look at the data besides our Macro Index
Housing data continues to deteriorate. The longer this persists, the stronger the long term bearish case becomes. So watch the data closely over the next several months.
While most of the housing data has been delayed by the government shutdown, the NAHB Housing Index demonstrates that this leading sector of the economy is still trending downwards.
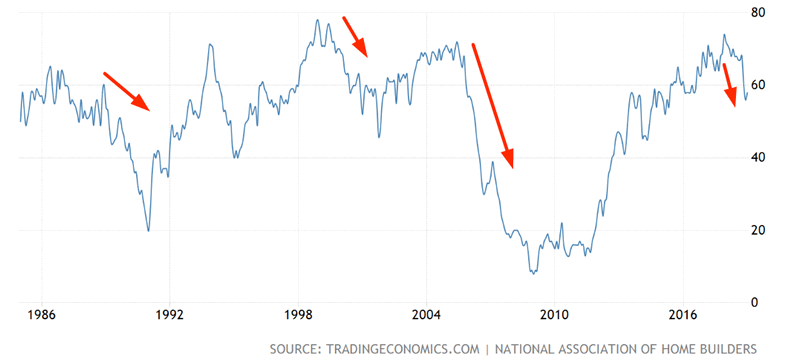
This figure trended downwards before a lot of historical bear markets and recessions began, with few false signals.
Meanwhile, the yield curve is close to being inverted. (10 year – 2 year and 10 year – 3 month are the most commonly monitored parts of the curve).
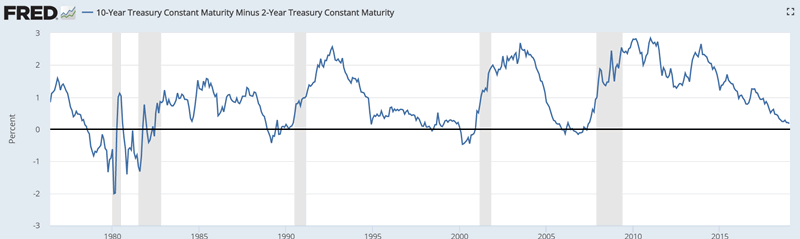
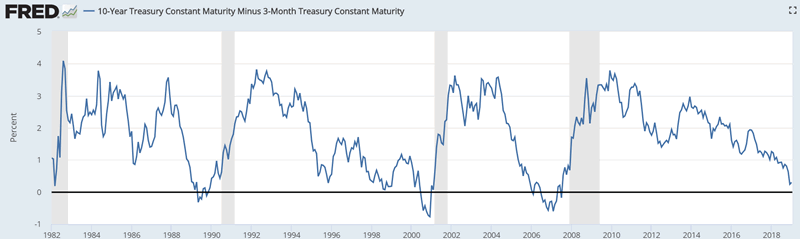
Source: FRED
And the most important part of the economy – the labor market – is no longer improving. Initial Claims and Continued Claims have been trending sideways for the past 6 months. This is not yet a long term bearish sign for the stock market and economy, but watch out if Claims start to trend upwards. They are already very low.
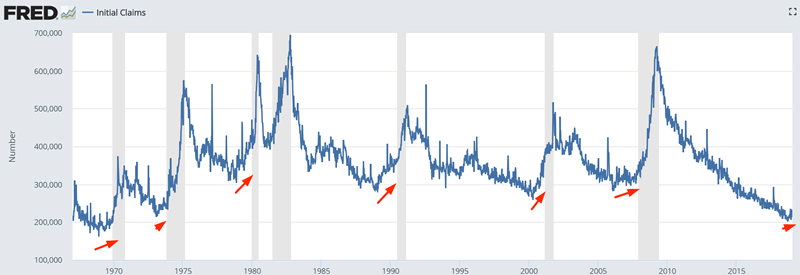
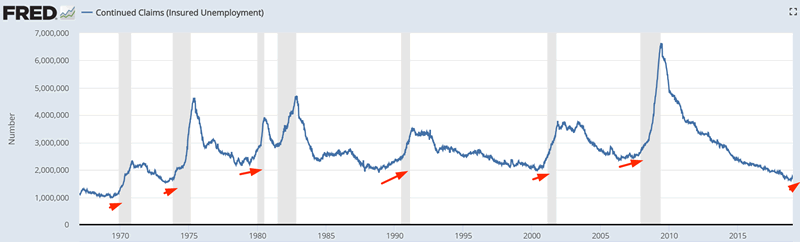
Source: FRED
Here’s what happened next to the S&P when the 3 month moving average for Initial Claims is higher than where it was 3 months ago, while the S&P is under its 200 dma and Initial Claims is under 300k (i.e. late cycle).
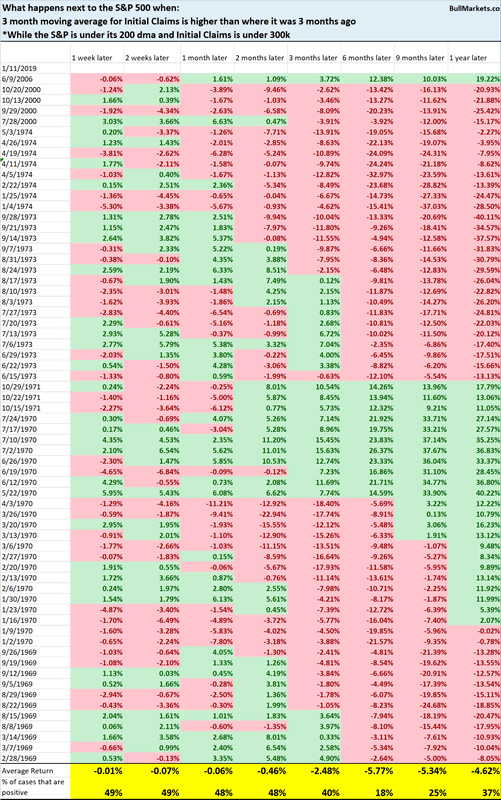
As you can see, the S&P’s long term forward returns are not good, particularly once Initial Claims started to trend upwards.
The stock market’s biggest long term problem right now is that as the economy reaches “as good as it gets” and stops improving, the long term risk is to the downside.
Medium Term
Now that the S&P has reached its 50% retracement level sooner than expected, our medium term market studies are mixed. Some are bullish while others are bearish. By now, the “stocks will retest after a crash” argument has become well known.
*For reference, here’s the random probability of the U.S. stock market going up on any given day, week, or month.

The bullish market studies center around “momentum”. “Momentum” is one of the only price action factors that remains constant throughout the decades. It has been studied extensively by financial professionals and academics. “Momentum” = “an object that is in motion tends to stay in motion”, which is just another way of saying that trends exist.
The stock market’s momentum was very strong going into September 2018, which is why from a statistical perspective, a decline the size of the one we saw in Q4 2018 was unlikely. This demonstrates that momentum isn’t perfect – but it’s better than most other forms of technical analysis. Ignore it at your own peril.
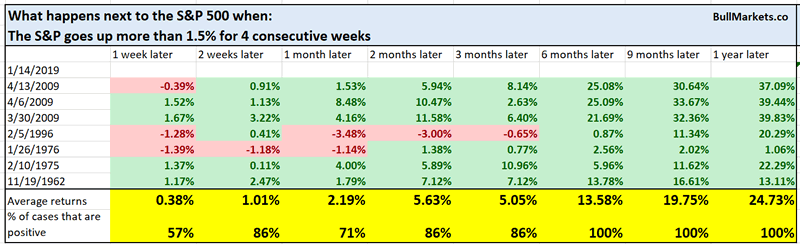
For example, the S&P has gone up more than 1.5% for 4 weeks in row.
Source: Investing.com
From 1950 – present, while this can lead to short term weakness, it is consistently bullish 6-12 months later.
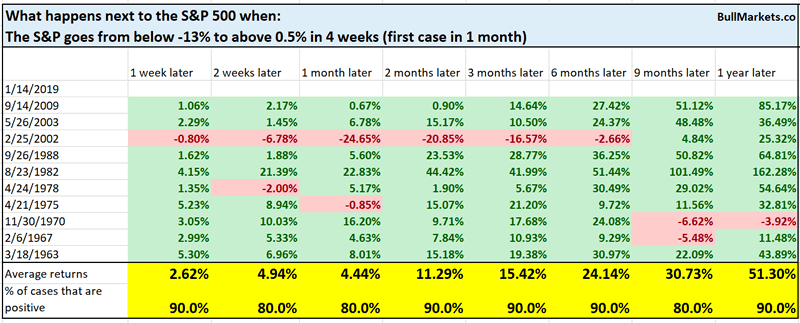
The S&P’s reversal from its December 2018 crash is equally notable. Here’s what happens next to the S&P when its 10 week rate of change goes from below -13% to above 0.5% within 4 weeks.
And for those who believe in seasonality, this is one of the strongest starts to the new year since 1950.
Here’s what happened next to the S&P when it went up more than 6% in the first 13 days of January.
*Data from 1950 – present
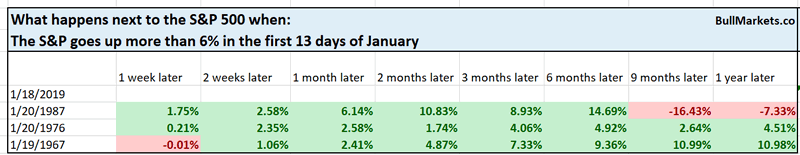
Rare, and not a bad long term sign for stocks.
As of Wednesday, the S&P has gone up more than 10% over the past 3 weeks while the 10 year Treasury yield has fallen. This is uncommon, because in a post-panic stock market rally, yields will often rise with stocks.
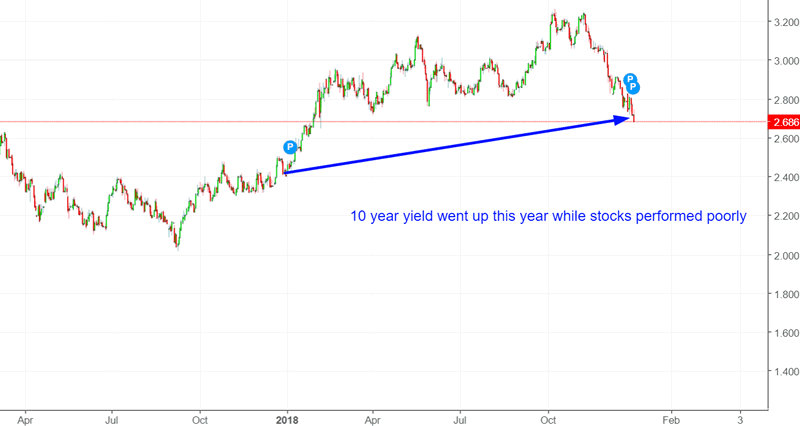
Source: Investing.com
Here’s what happened next to the S&P when it went up more than 10% over the past 3 weeks while the 10 year yield fell, while the S&P is below its 200 dma (first case in 1 month)
*Data from 1962 – present
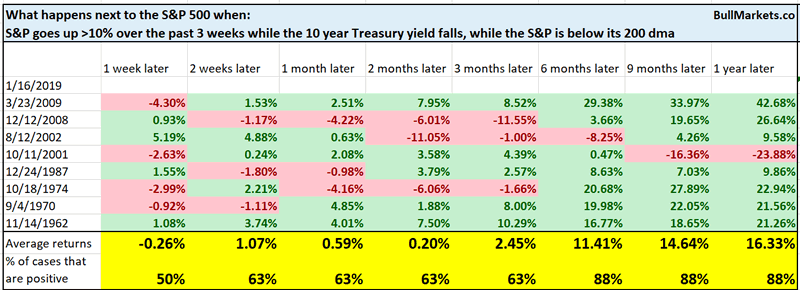
Mostly bullish for stocks 6-12 months later, with the exception of 2001.
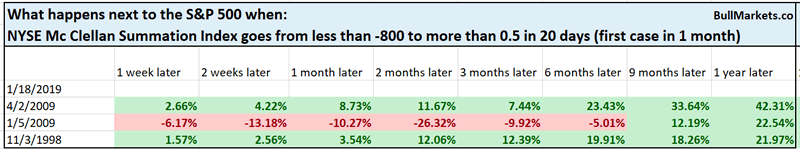
The NYSE McClellan Summation Index has reversed from extremely low levels. In the only 3 similar historical cases from 1998 – present, this was close to marking long term bottoms, even if the stock market went lower in the short term.
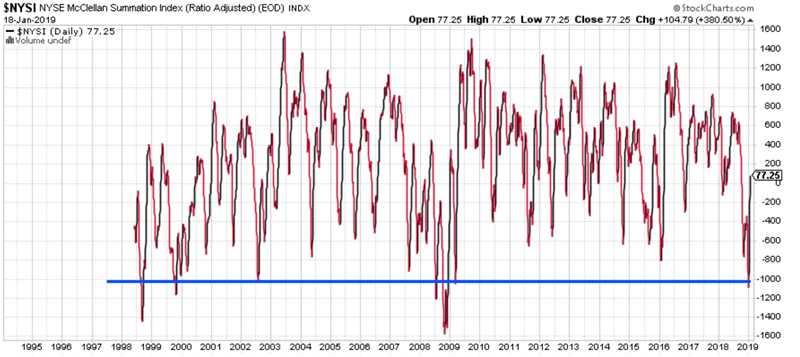
Source: StockCharts
*As I said before, take all breadth indicators with a grain of salt. As ETFs gain in popularity, it becomes easier and easier for breadth to reach extremes. Hence, breadth extremes that marked long term bottoms in the past might only mark medium term bottoms today.
In terms of sector analysis, it’s shocking how much defensive sectors have underperformed during the stock market’s rally.
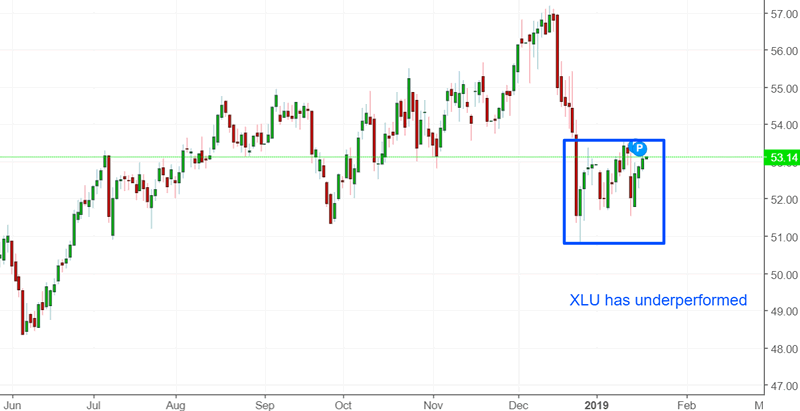
From 1998 – present, there’s only 1 other case in which the S&P went up more than 10% over the past 4 weeks while XLU (utilities ETF) fell.
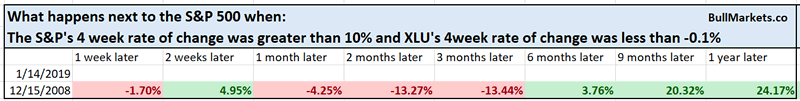
This was close to the long term bottom of the 2007-2009 bear market in terms of time, which was followed by a massive bull market.
Medium term market studies are mostly mixed, with a few more bearish than bullish. This is due to the large probability of a pullback/retest
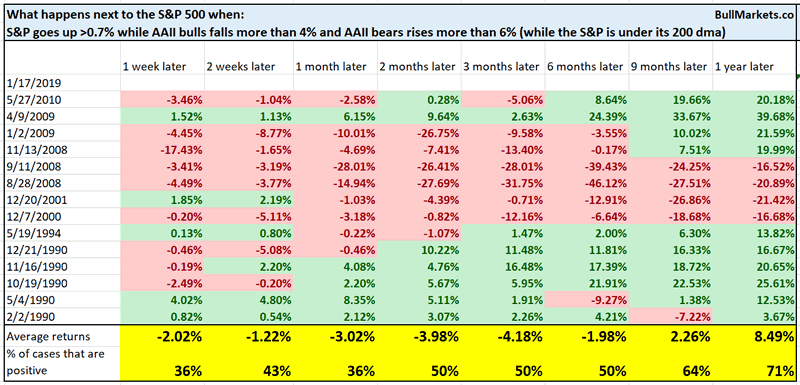
The interesting thing about last week’s AAII report is that while the stock market went up, AAII bulls % fell and AAII bears % went up.
Similar cases in which the S&P was below its 200 dma were short term bearish (i.e. 1 month later). Looks like many investors are looking for a retest/pullback.
Earnings season has started, and the S&P 500 is under its 200 day moving average.
- When the stock market crashes just before earnings season, it almost always rallies during earnings season, even if the earnings reports are bad. This was true even in the darkest hours of 2008. (Earnings report = trigger).
- When the stock market doesn’t crash just before earnings season (i.e. right now), the stock market can go up, down, or sideways on their earnings report (i.e. random outcome).
Here’s what happened next to the S&P 500 during the last 3 weeks of January (earnings season), while it is below its 200 dma.
*Data from 1950 – present
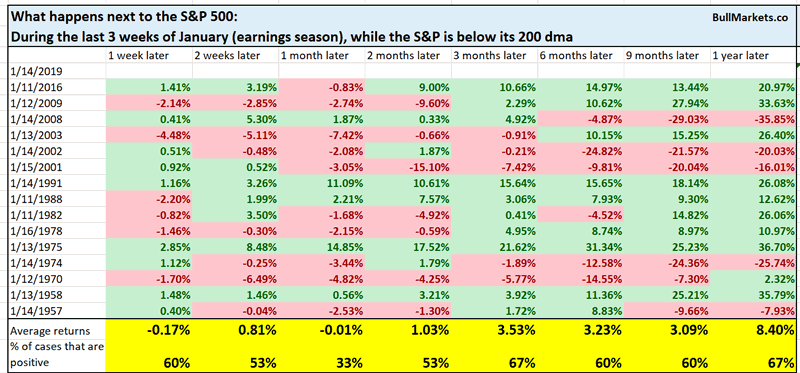
As you can see, the stock market has a bearish tendency over the next 1 month, particularly after earnings season (2-4 weeks later). Perhaps stocks will fall after earnings season is over? We don’t focus on the short term.
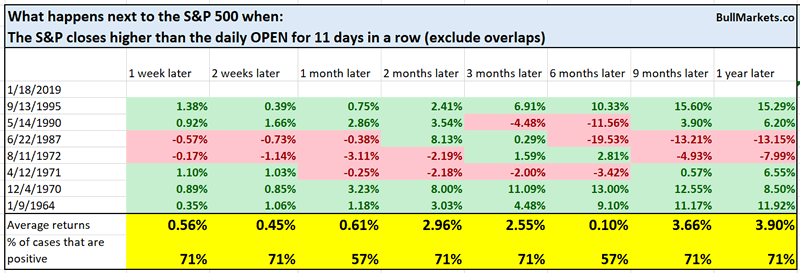
The stock market’s rally has been very steady. The S&P has closed higher than the daily OPEN for 11 days in a row. Historically, this led to mixed forward returns for the stock market over the next few months.
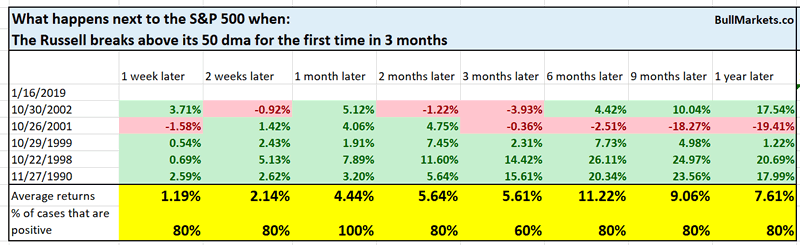
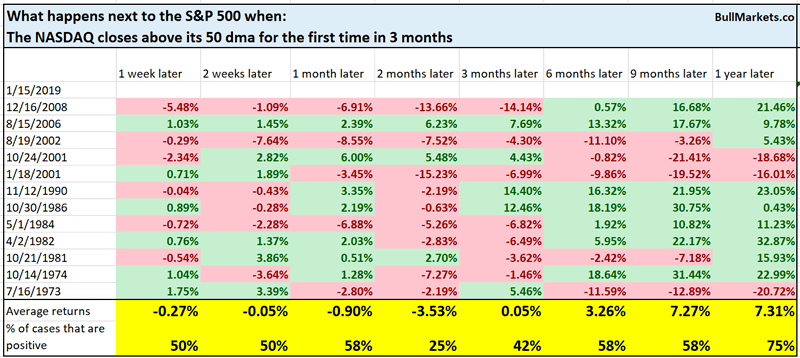
The Russell 2000 and NASDAQ have broken above their 50 daily moving averages for the first time in a long time. While this wasn’t a consistently bearish sign for stocks over the next 1 month, it often led to weakness 2 months later.
Short Term
The stock market’s short term outlook has a slight bearish lean right now due to the high probability of a pullback/retest.
However, it’s important to focus on the medium-long term instead of the short term. There is a lot of randomness in the short term, which makes it very difficult to predict.
Let time work probability out to its “true mean”.
Conclusion
Here is our discretionary market outlook:
- The U.S. stock market’s long term risk:reward is no longer bullish. This doesn’t necessarily mean that the bull market is over. We’re merely talking about long term risk:reward. Long term risk:reward is more important than trying to predict exact tops and bottoms.
- The medium term direction (i.e. next 3-6 months) is neutral. Some market studies are medium term bullish while others are medium term bearish
- The stock market’s short term has a slight bearish lean. Focus on the medium-long term (and especially the long term) because the short term is extremely hard to predict.
Our discretionary outlook is not a reflection of how we’re trading the markets right now. We trade based on our quantitative trading models, such as the Medium-Long Term Model.
Members can see exactly how we’re trading the U.S. stock market right now based on our trading models.
Click here for more market studies
By Troy Bombardia
I’m Troy Bombardia, the author behind BullMarkets.co. I used to run a hedge fund, but closed it due to a major health scare. I am now enjoying life and simply investing/trading my own account. I focus on long term performance and ignore short term performance.
Copyright 2018 © Troy Bombardia - All Rights Reserved
Disclaimer: The above is a matter of opinion provided for general information purposes only and is not intended as investment advice. Information and analysis above are derived from sources and utilising methods believed to be reliable, but we cannot accept responsibility for any losses you may incur as a result of this analysis. Individuals should consult with their personal financial advisors.
© 2005-2022 http://www.MarketOracle.co.uk - The Market Oracle is a FREE Daily Financial Markets Analysis & Forecasting online publication.