


Stocks Rallied Again, Still Just an Upward Correction?
Stock-Markets / Stock Markets 2019 Jan 07, 2019 - 04:18 PM GMTBy: Paul_Rejczak

 Stocks rallied on Friday following better-than-expected monthly jobs data release. Will the uptrend continue? Or is this just a quick upward correction before another leg lower?
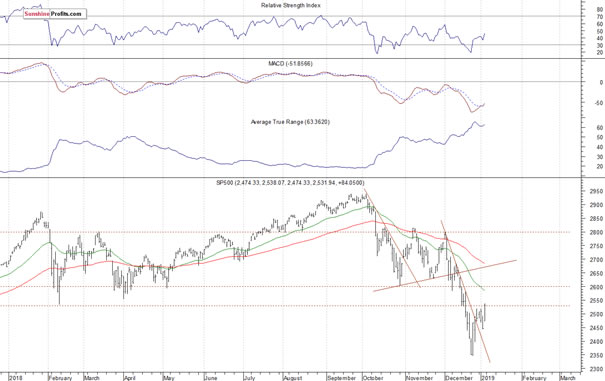
The U.S. stock market indexes gained 3.3-4.3% on Friday, as investors reacted to better-than-expected Nonfarm Payrolls number release. The S&P 500 index extended its recent rebound off the December the 26th medium-term low of 2,346.58. It traded 20.2% below September the 21st record high of 2,940.91 on that day. Then the market rallied and retraced some of the downtrend. It got back above 2,500 mark on Friday. The Dow Jones Industrial Average gained 3.3% and the Nasdaq Composite gained 4.3%.
The nearest important level of resistance of the S&P 500 index is now at 2,530-2,550, marked by some previous fluctuations. The resistance level is also at 2,570-2,600. On the other hand, the level of support is at 2,500, and the next support level remains at 2,450-2,475, marked by some recent local lows.
The broad stock market broke below its two-month-long trading range recently, as the S&P 500 index fell below the level of 2,600. Then the market accelerated lower and it broke below the level of 2,400. The downward correction reached 20.2% from the September all-time high, surpassing January-February correction of around 12%. Is this a long-term bear market? It still looks like a medium-term downward correction, but the index remains below the recent consolidation, as we can see on the daily chart:
Consolidation Following Friday's Rally
Expectations before the opening of today's trading session are virtually flat, because the index futures contracts trade between -0.2% and +0.1% vs. their Friday's closing prices. The European stock market indexes have lost 0.6% so far. Investors will wait for the ISM Non-Manufacturing PMI number release at 10:00 a.m. The broad stock market may fluctuate following its Friday's rally. For now, it looks like another consolidation following the recent rebound.
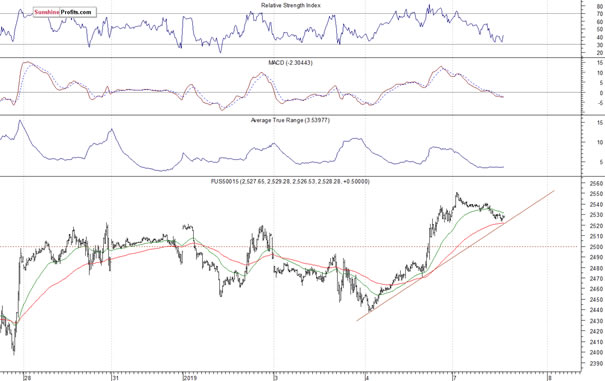
The S&P 500 futures contract trades within an intraday downtrend, as it retraces some of the Friday's rally. The nearest important level of support is at 2,500-2,510, marked by the recent resistance level. On the other hand, the level of resistance is now at 2,550, marked by the local high. The futures contract is close to the short-term upward trend line, as the 15-minute chart shows:
Nasdaq Trades Along 6,400
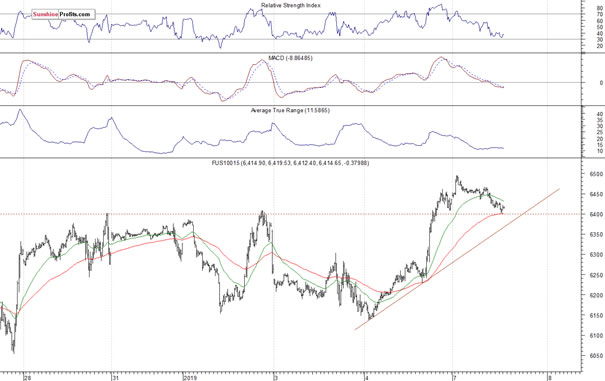
The technology Nasdaq 100 futures contract follows a similar path, as it retraces some of the Friday's rally this morning. The nearest important resistance level is at 6,450-6,500. On the other hand, the support level is at 6,350-6,400. The Nasdaq futures contract is above its recent trading range, as we can see on the 15-minute chart:
Big Cap Tech Stocks - Short-Term Uptrend?
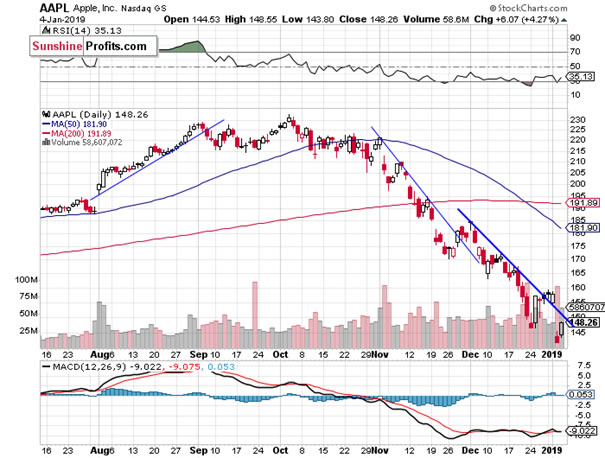
Let's take a look at Apple, Inc. stock (AAPL) daily chart (chart courtesy of http://stockcharts.com). The stock sold off on Thursday, as it reached the new medium-term low of $142. We saw clear short-term oversold conditions and the stock retraced some of its recent decline on Friday. However, there have been no confirmed positive signals so far. It is below the month-long downward trend line again:
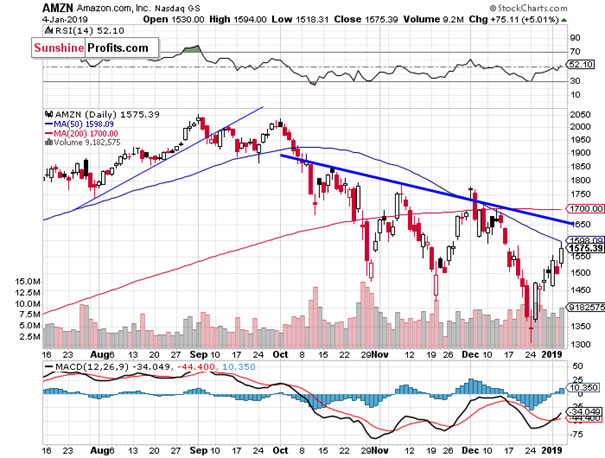
Now let's take a look at Amazon.com, Inc. stock (AMZN) daily chart. The stock accelerated its downtrend in the late December and it reached the new medium-term low of $1,307. Was the recent rally an upward reversal? For now, it looks like another upward correction. The market remains below its three-month-long downward trend line:
Dow Jones Above the Recent Local Highs
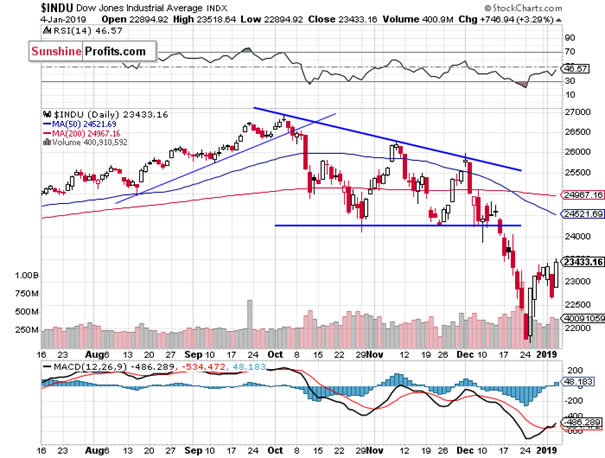
The Dow Jones Industrial Average broke below its two-month-long consolidation in the mid-December and then it accelerated much lower. The blue-chip stocks' gauge fell below the level of 22,000. It slightly extended the downtrend recently before sharply reversing higher and getting back to 23,000 mark. So was it an upward reversal or just a correction within a downtrend? The market remains below its October - December trading range:
Japanese Nikkei at 20,000 Mark
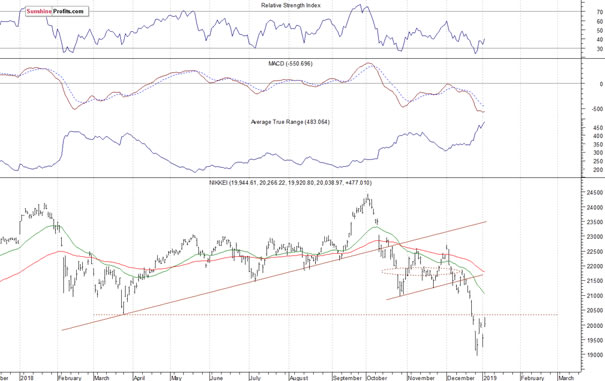
Let's take a look at the Japanese Nikkei 225 index. It accelerated the downtrend in the late December, as it fell slightly below the level of 19,000. Since then it trades within a consolidation. Is this a bottoming pattern or just some flat correction before another leg down?. The resistance level is at around 20,000, as the daily chart shows:
The S&P 500 index extended its downtrend in the late December, before reversing higher. The broad stock market was more than 20% below its September's record high on December the 26th. Is this a new long-term bear market or just medium-term downward correction? For now, it looks like a correction. However, there have been no confirmed medium-term positive signals so far. The market retraced some of its recent decline, but it continues to trade below the important resistance levels.
Concluding, the S&P 500 index will likely open slightly lower today. We may see a short-term consolidation following Friday's rally. The index may continue to fluctuate along the level of 2,500.
If you enjoyed the above analysis and would like to receive free follow-ups, we encourage you to sign up for our daily newsletter – it’s free and if you don’t like it, you can unsubscribe with just 2 clicks. If you sign up today, you’ll also get 7 days of free access to our premium daily Gold & Silver Trading Alerts. Sign up now.
Thank you.
Paul Rejczak
Stock Trading Strategist
Stock Trading Alerts
SunshineProfits.com
Stock market strategist, who has been known for quality of his technical and fundamental analysis since the late nineties. He is interested in forecasting market behavior based on both traditional and innovative methods of technical analysis. Paul has made his name by developing mechanical trading systems. Paul is the author of Sunshine Profits’ premium service for stock traders: Stock Trading Alerts.
* * * * *
Disclaimer
All essays, research and information found above represent analyses and opinions of Paul Rejczak and Sunshine Profits' associates only. As such, it may prove wrong and be a subject to change without notice. Opinions and analyses were based on data available to authors of respective essays at the time of writing. Although the information provided above is based on careful research and sources that are believed to be accurate, Paul Rejczak and his associates do not guarantee the accuracy or thoroughness of the data or information reported. The opinions published above are neither an offer nor a recommendation to purchase or sell any securities. Mr. Rejczak is not a Registered Securities Advisor. By reading Paul Rejczak’s reports you fully agree that he will not be held responsible or liable for any decisions you make regarding any information provided in these reports. Investing, trading and speculation in any financial markets may involve high risk of loss. Paul Rejczak, Sunshine Profits' employees and affiliates as well as members of their families may have a short or long position in any securities, including those mentioned in any of the reports or essays, and may make additional purchases and/or sales of those securities without notice.
Paul Rejczak Archive |
© 2005-2022 http://www.MarketOracle.co.uk - The Market Oracle is a FREE Daily Financial Markets Analysis & Forecasting online publication.