


What Will the Stock Market do in 2019?
Stock-Markets / Stock Markets 2019 Jan 02, 2019 - 03:29 PM GMTBy: Troy_Bombardia

 What will the U.S. stock market do in 2019? It depends on who you ask.
- Wall Street analysts are generally bullish. The average analysts’ year-end 2019 prediction is 3000 for the S&P. Analysts have a bullish bias.
- The media is bearish (again), as they are every year. The media (financial media, social media, bloggers) have a bearish bias because bad news sells. It’s in their interest to sensationalize everything and scare the crap out of you. Scary headlines = more attention & ad revenue.
But as always, here at Bull Markets we try to follow the data and remain as objective as possible. We don’t always get it right, but following the data = a much better success % vs. random guessing.
Go here to understand our fundamentals-driven long term outlook.
Let’s determine the stock market’s most probable medium term direction by objectively quantifying technical analysis. For reference, here’s the random probability of the U.S. stock market going up on any given day.

*Probability ≠ certainty. Past performance ≠ future performance. But if you don’t use the past as a guide, you are walking blindly into the future.
Disconnect between fundamentals and the stock market
Macro started to deteriorate in August before the stock market tanked. But our Macro Index is a leading indicator.
Meanwhile, lagging economic indicators (GDP and earnings growth) have been very strong while stocks tanked in Q4 2018. Disconnect between the economy and stock market is normal during a bull market, but not this level of disconnect.
Earnings growth has exceeded 15% this year while the S&P fell more than -6%
Here’s every calendar year this happened, from 1928 – present
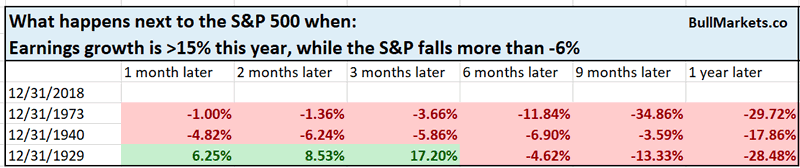
As you can see, the 3 historical cases were all very long term bearish cases.
At the end of a bull market, leading economic indicators will deteriorate (which they have since August 2018), then the stock market will top while lagging indicators are still very strong (e.g. GDP and earnings growth).
*Take this study with a grain of salt, especially because some of the earnings growth comes from Trump’s tax cut. N = 3. But it does illustrate that this huge disconnect is not good for stocks.
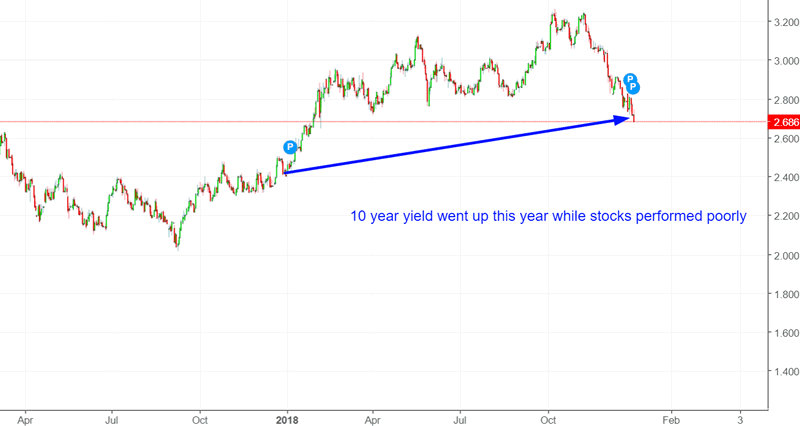
Rising interest rates
Contrary to popular belief, rising interest rates aren’t bearish for stocks.
The stock market’s correlation with rising interest rates is completely random. When interest rates go up:
- Sometimes the stock market will fall.
- Sometimes the stock market will be flat.
- Sometimes the stock market will rise.
However, when rising interest rates do cause stocks to fall, the stock market tends to fall even more in the future.
Here’s what happened next to the S&P when it fell more than -6% over the past year, while the 10 year yield went up more than 0.8%
*Data from 1962 – present
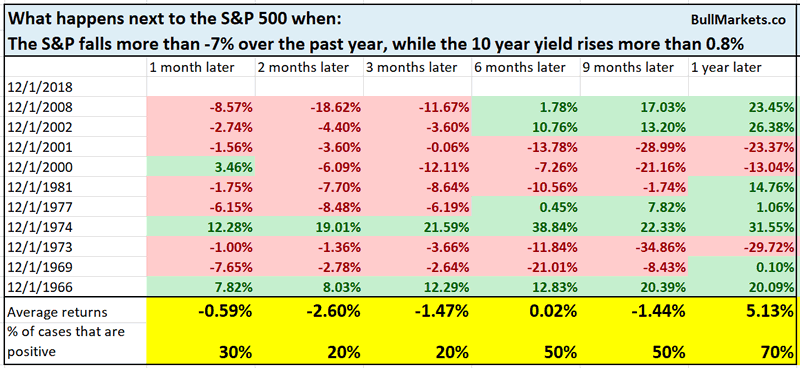
As you can see, the stock market has a strong bearish lean over the next 3 months.
Financial Conditions
Here’s another way to look back on 2018.
Last Friday we looked at what happens next to the S&P when the S&P falls over 3 months while financial conditions don’t tighten at all.
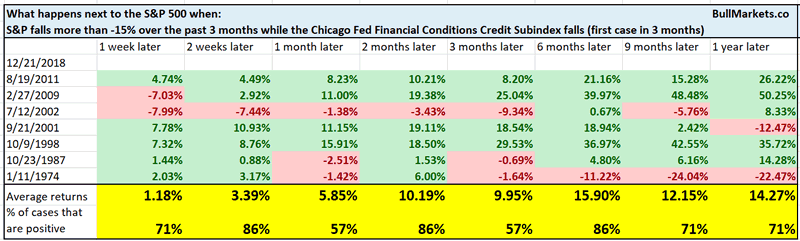
We can do the same study, but on a yearly basis.
Here’s what happens next to the S&P 500 when the S&P falls more than -6% in a calendar year, while Credit Conditions don’t tighten at all.
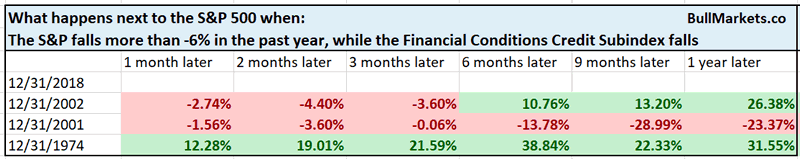
Interestingly enough, this tends to happen towards the end of bear markets.
N = 3. With an extremely small sample size, take this with a grain of salt
Equity Put/Call
The Equity Put/Call Ratio tanked last Friday.
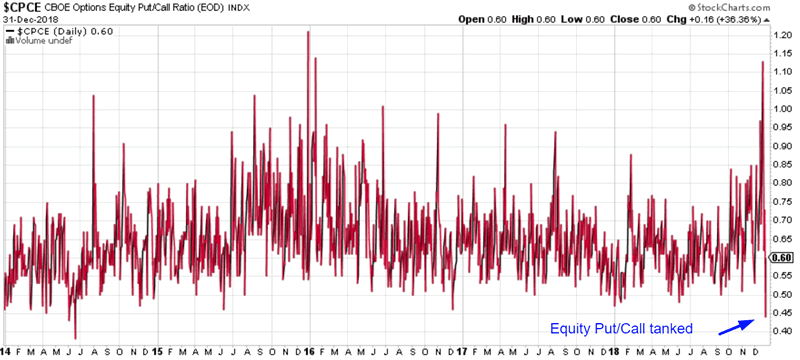
Is this a short term bearish sign for the stock market? Keep in mind that this might be due to the low-volume holiday season.
Here’s what happened next to the S&P when the Equity Put/Call Ratio fell below 0.45
*Data from 2003 – present
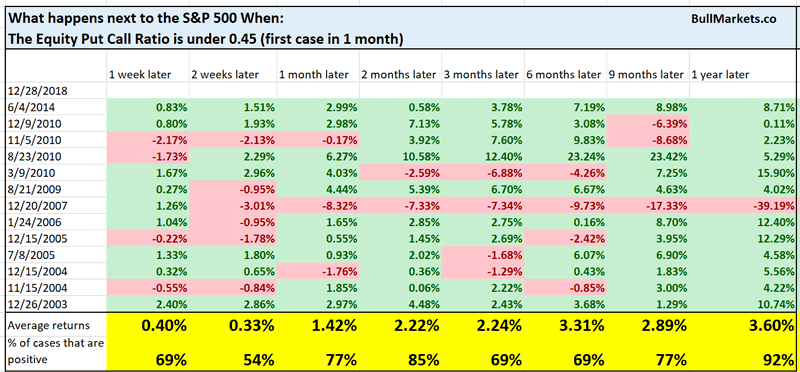
This is not consistently bearish for stocks on any time frame.
Macro Context
Terrible December
This is officially the 2nd worst December for U.S. stocks since the Great Depression.
Here’s every single case in which the S&P fell more than -4% in December, and what it did next.
*Data from 1928 – present
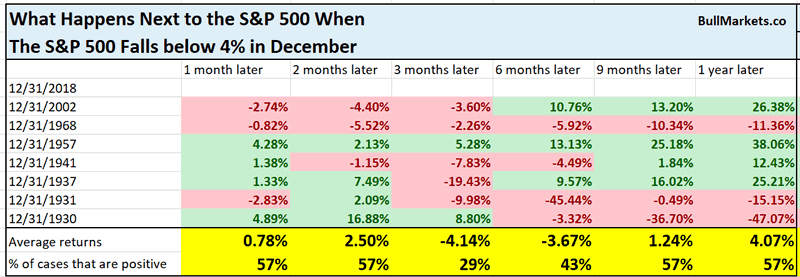
Notice how the stock market has a strong bearish lean over the next 3 months.
*Seasonality factors are of secondary importance.
Standard deviations
As the stock market tanked, the S&P 500’s standard deviations (used in Bollinger Bands) have expanded dramatically.
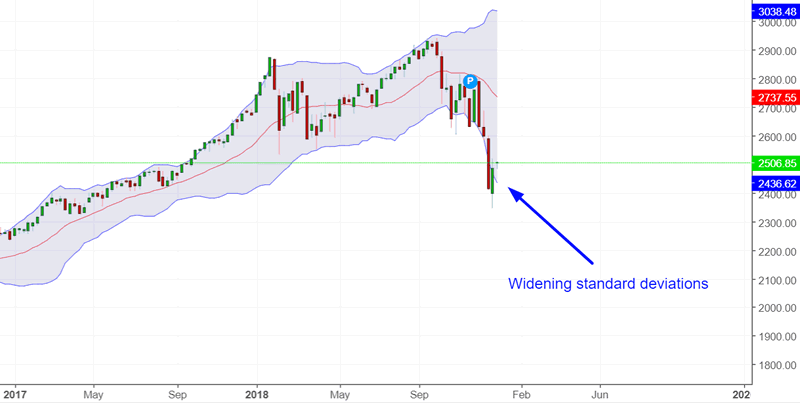
Some of the good analysts that I follow see this as a bullish contrarian sign. Are they correct?
Here’s what happened next to the S&P when its 20 weekly standard deviation expanded to >5.5% of the S&P’s value.
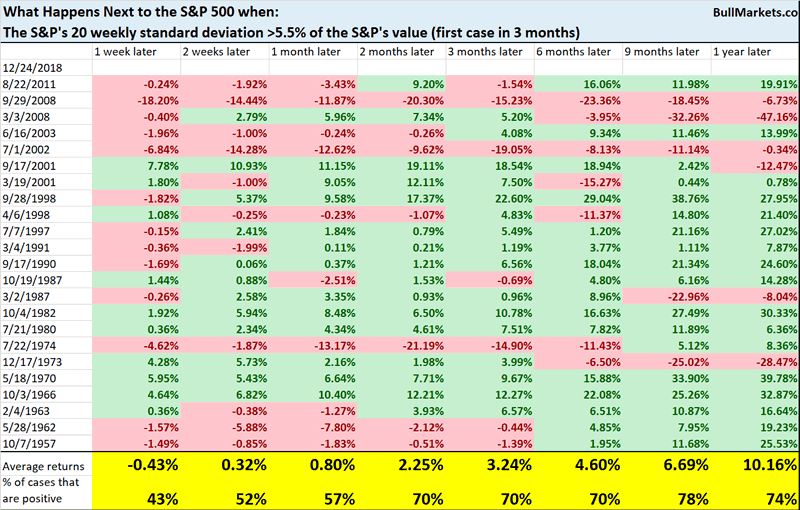
*Data from 1950 present
Interestingly enough, there is a slight bearish lean over the next 1 week.
Macro Context
What to do in 2019
The best thing to do in 2019 is to keep an open mind, especially this late in the economic expansion cycle.
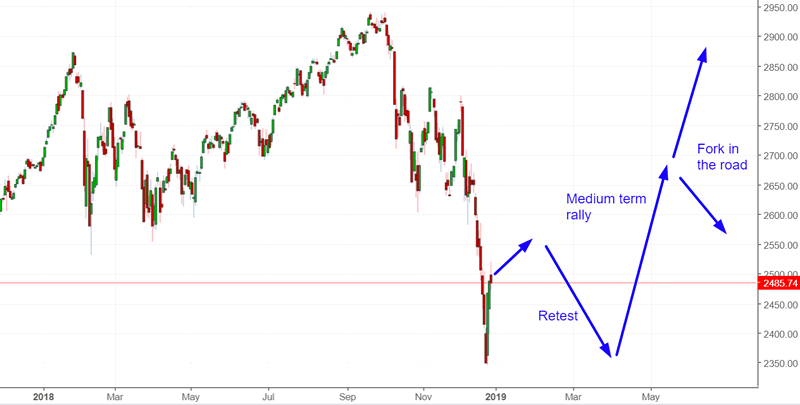
There are 3 base cases for 2019:
- The stock market soars in 2019, like 1999. Everyone thought that the 20% decline in 1998 marked the start of a much bigger bear market. It wasn’t. That late-cycle bull market continued for another 1.5 years. Some of the best analysts I follow think that this is a strong possibility. The stock market frequently does the unexpected.
- The stock market bounces around in a wide range for the first 3-6 months of 2019, after which it really tanks as the economy sinks into a recession.
- The stock market crashes immediately. (This is the case that permabears love.)
In my opinion, the 2nd case is most likely because it’s the one that fundamentals support right now.
The key point is to have an open mind and be flexible as new data and facts come in.
Conclusion
Here is our discretionary market outlook:
- The U.S. stock market’s long term risk:reward is no longer bullish. This doesn’t necessarily mean that the bull market is over. We’re merely talking about long term risk:reward. Since no one can consistently and accurately predict every long term top & bottom, it’s better to focus on risk:reward than trying to catch exact tops and bottoms.
- The medium term direction is still bullish (i.e. trend for the next 6 months). However, if this is the start of a bear market, bear market rallies typically last 3 months. They are shorter in duration.
- The stock market’s short term has a slight bearish lean. Focus on the medium-long term because the short term is extremely hard to predict.
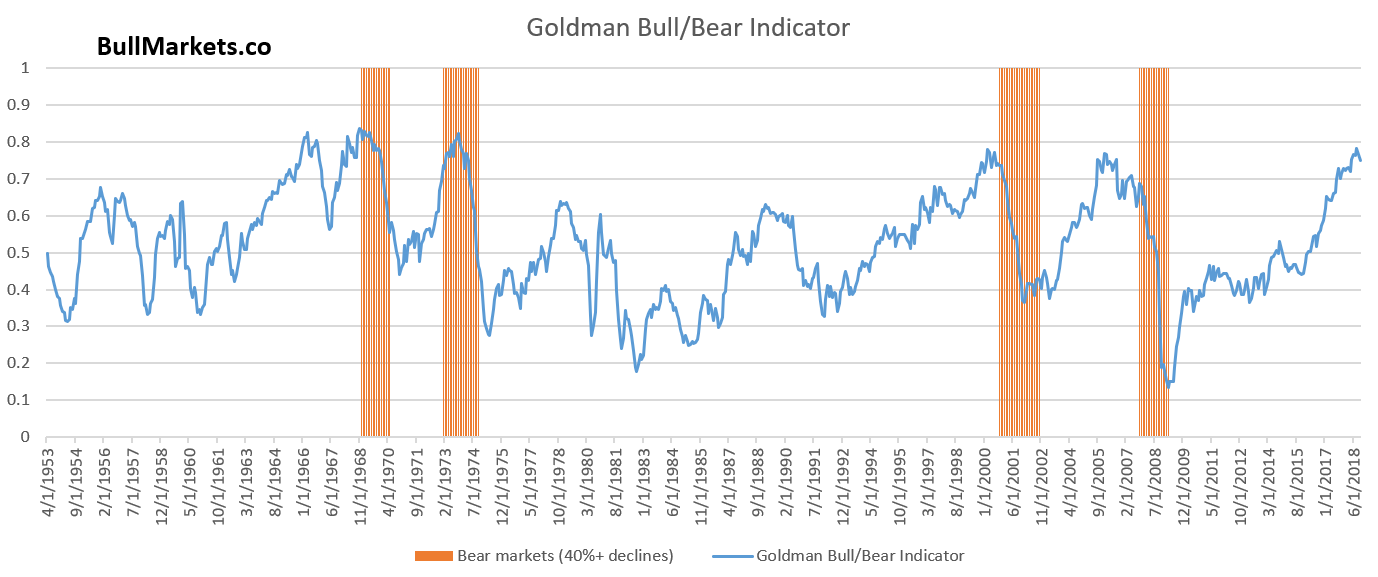
Goldman Sachs’ Bull/Bear Indicator demonstrates that while the bull market’s top isn’t necessarily in, risk:reward does favor long term bears.
Our discretionary outlook is not a reflection of how we’re trading the markets right now. We trade based on our quantitative trading models.
Members can see exactly how we’re trading the U.S. stock market right now based on our trading models.
Click here for more market studies
By Troy Bombardia
I’m Troy Bombardia, the author behind BullMarkets.co. I used to run a hedge fund, but closed it due to a major health scare. I am now enjoying life and simply investing/trading my own account. I focus on long term performance and ignore short term performance.
Copyright 2018 © Troy Bombardia - All Rights Reserved
Disclaimer: The above is a matter of opinion provided for general information purposes only and is not intended as investment advice. Information and analysis above are derived from sources and utilising methods believed to be reliable, but we cannot accept responsibility for any losses you may incur as a result of this analysis. Individuals should consult with their personal financial advisors.
© 2005-2022 http://www.MarketOracle.co.uk - The Market Oracle is a FREE Daily Financial Markets Analysis & Forecasting online publication.