


The Stock Market Made a Sharp Reversal Last Week. What’s Next
Stock-Markets / Stock Markets 2019 Dec 31, 2018 - 02:11 PM GMTBy: Troy_Bombardia

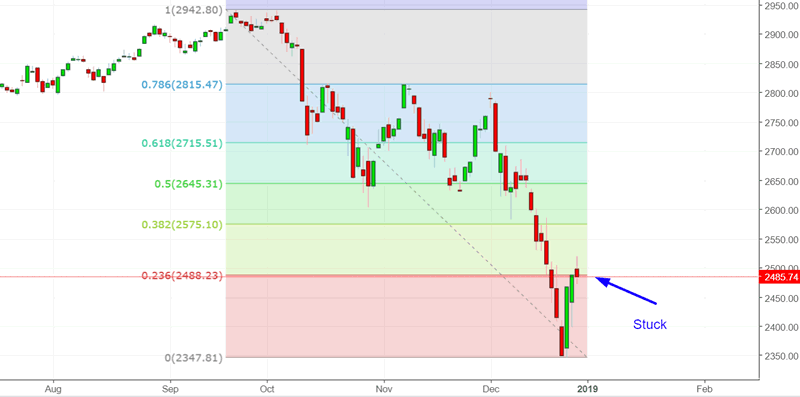
The stock market is making an oversold bounce right now, and is stuck at its fibonacci retracement (23.6%). The standard target for a bounce is 38.2% – 50%
Go here to understand our fundamentals-driven long term outlook.
Let’s determine the stock market’s most probable medium term direction by objectively quantifying technical analysis. For reference, here’s the random probability of the U.S. stock market going up on any given day, week, or month.

*Probability ≠ certainty. Past performance ≠ future performance. But if you don’t use the past as a guide, you are walking blindly into the future.
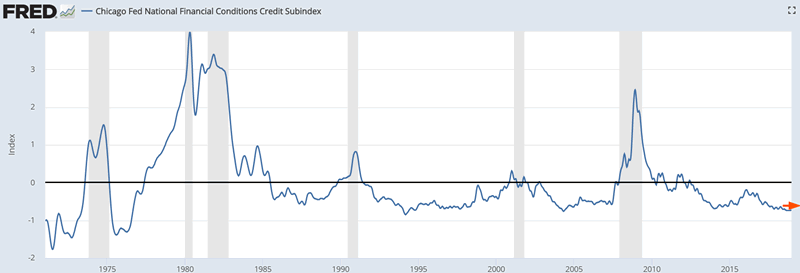
Chicago Fed National Financial Conditions Credit Subindex
One of the weirdest things about the recent -20% decline is how the Chicago Fed’s Financial Conditions Credut Subindex has not tightened (increased) at all.
Credit tends to tighten (increase) when the stock market tanks and the economy deteriorates.
Here’s what happened next to the S&P 500 when the S&P fell more than -15% over the past 3 months, while Credit Conditions did not tighten at all.
*Data from 1971 – present
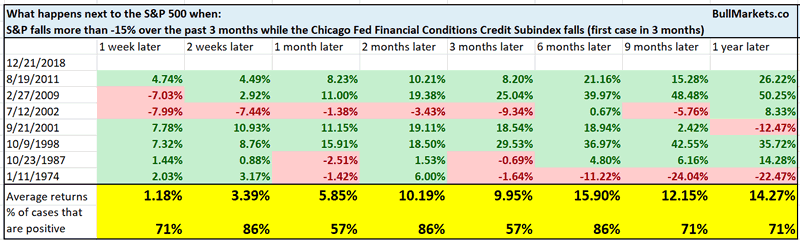
As you can see, the stock market tends to make a multi-month rally. -15% declines that occur within a recession are bearish, while -15% declines that occur without a recession are bullish.
Macro context
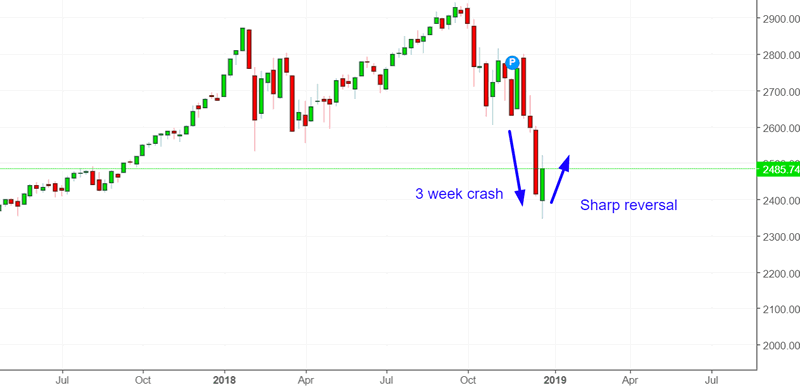
Sharp reversal
This week saw a very sharp upwards reversal in the S&P 500.
*This illustrates the problem with staring at charts. When you form a market outlook by eyeballing the chart, you are susceptible to recency bias (extrapolating the present into the future). The human brains sees what it wants to see when staring at a chart. On the other hand, data is unbiased.
Here’s what happened next to the S&P when it fell more than -15% over the past 4 weeks, and then reversed upwards more than 5% this week.
*Data from 1950 – present
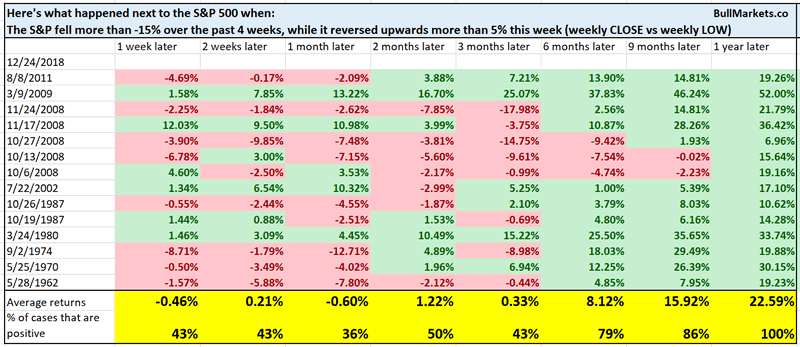
Here we can see an interesting pattern.
- The stock market tends to fall over the next 1 month
- The stock market has a very strong tendency to rise 9-12 months later.
This illustrates the standard “crash, bounce, retest” pattern that typically plays out.
Macro context
AAII Bear
AAII is one of the more widely followed sentiment reports. Sentiment is quite bearish right now, with more than 50% of the survey’s participants being bearish.
Here’s what happened next to the S&P when AAII Bears exceeded 47% for 3 weeks in a row, while the unemployment rate was less than 6% (i.e. late-cycle bearish sentiment)
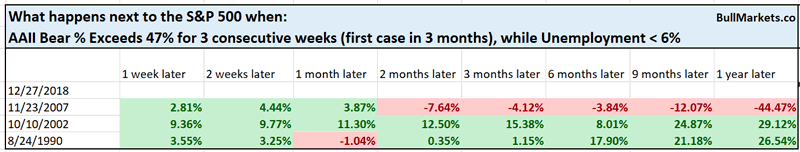
You can see that this is rare, and is not consistently bullish nor bearish for the stock market.
This study illustrates the problem with most sentiment indicators:
- Bearish sentiment in a bull market is bullish
- Bearish sentiment in a bear market is bearish. Price can keep falling.
This is why I underweight the importance of sentiment.
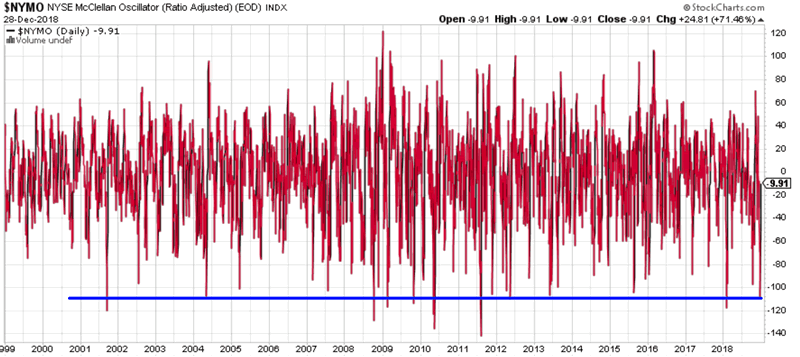
NYSE McClellan Oscillator
The NYSE McClellan Oscillator is a breadth indicator. After posting an extreme reading during the pre-Christmas stock market crash, it has snapped back to a more normal level with the stock market’s bounce.
Here’s what happened next to the S&P 500 when the NYSE McClellan Oscillator went from under -100 to above -10 within 2 weeks
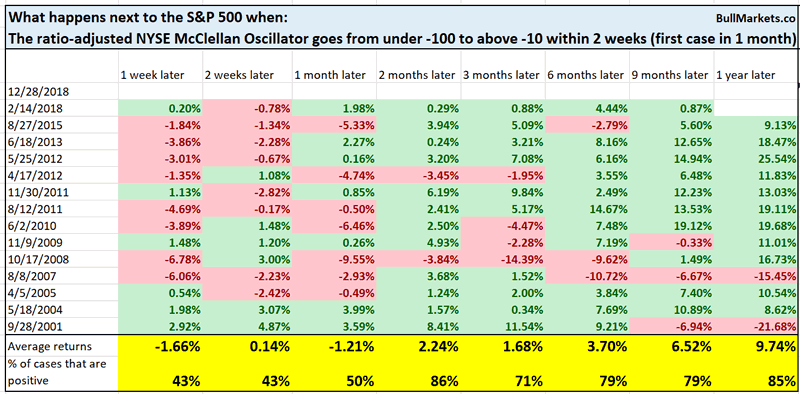
Once again, there is a slight tendency for the S&P to fall over the next 2 weeks (retest).
Macro context
NYSE New Lows Index
The NYSE New Lows Index looks at how many issues in the NYSE Index are making new lows.
You should not use the absolute value of this figure. As the number of issues on the NYSE increases over the decades, this figure will forever go higher.
Hence, it’s better to look at the NYSE New Lows vs. readings over its recent history.
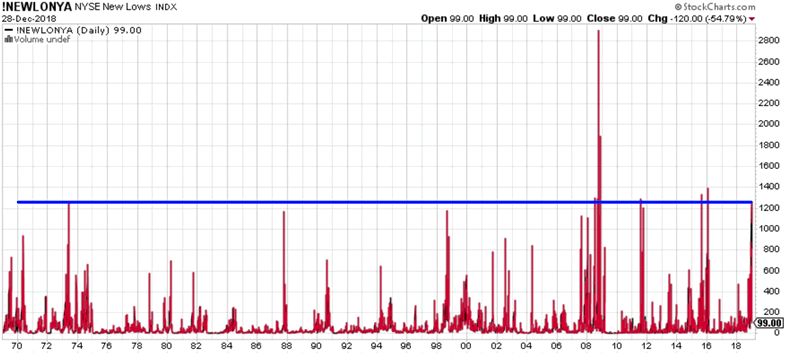
The # of issues making new lows spiked as the stock market tanked before Christmas, and has now fallen as the stock market has bounced.
Here’s what happened next to the S&P when the NYSE New Lows Index went from more than 800% above its 3 year moving average to less than 100% above its 3 year moving average.
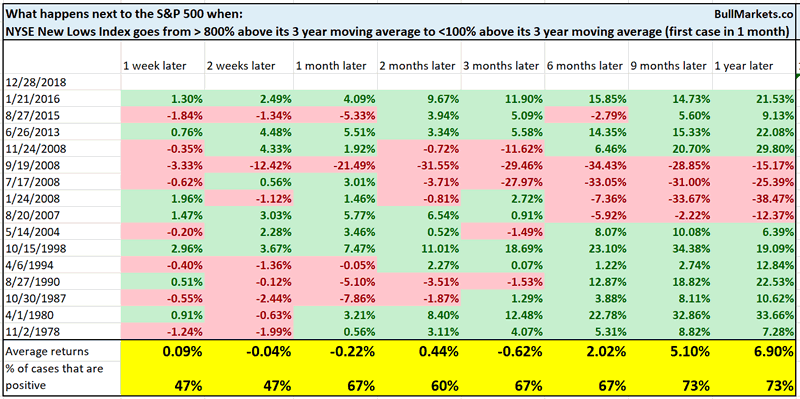
Once again, there’s a slight tendency for a retest over the next few weeks.
Macro context
Why the short term outlook is neutral
Based on these market studies, it would make sense for my short term market outlook to be bearish (short term retest, then medium term rally).
However, this -20% decline was so extreme, so there is a possibility that the stock market will go straight up without a short term retest.
- Normally, there’s probably a 2/3 chance that the stock market retests
- But because this -20% decline was fierce enough to begin with, there’s probably a 50% chance of a V-shaped bottom.
Anyways, the short term is always very hard to predict, which is why I focus on the medium-long term.
Click here for yesterday’s market studies
Conclusion
Here is our discretionary market outlook:
- For the first time since 2009, the U.S. stock market’s long term risk:reward is no longer bullish. This doesn’t necessarily mean that the bull market is over. We’re merely talking about long term risk:reward.
- The medium term direction is still bullish (i.e. trend for the next 6 months). However, if this is the start of a bear market, bear market rallies typically last 3 months. They are shorter in duration. Bear market rallies are choppy and fierce.
- The short term is a 50/50 bet
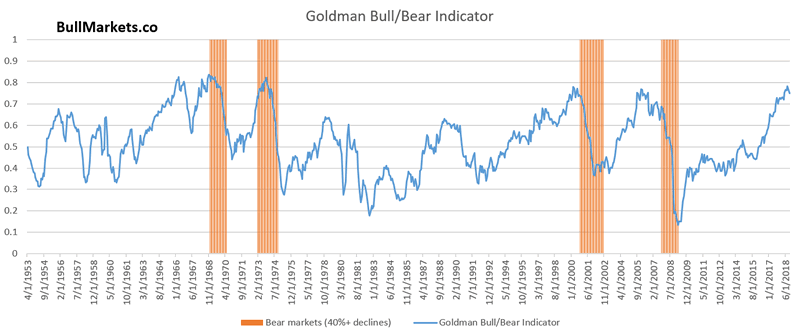
Goldman Sachs’ Bull/Bear Indicator demonstrates that while the bull market’s top isn’t necessarily in, risk:reward does favor long term bears.
Our discretionary outlook is not a reflection of how we’re trading the markets right now. We trade based on our quantitative trading models, such as the Medium-Long Term Model.
Members can see exactly how we’re trading the U.S. stock market right now based on our trading models.
Click here for more market studies
By Troy Bombardia
I’m Troy Bombardia, the author behind BullMarkets.co. I used to run a hedge fund, but closed it due to a major health scare. I am now enjoying life and simply investing/trading my own account. I focus on long term performance and ignore short term performance.
Copyright 2018 © Troy Bombardia - All Rights Reserved
Disclaimer: The above is a matter of opinion provided for general information purposes only and is not intended as investment advice. Information and analysis above are derived from sources and utilising methods believed to be reliable, but we cannot accept responsibility for any losses you may incur as a result of this analysis. Individuals should consult with their personal financial advisors.
© 2005-2022 http://www.MarketOracle.co.uk - The Market Oracle is a FREE Daily Financial Markets Analysis & Forecasting online publication.