


Cyclical Assets vs. Gold
Commodities / Gold and Silver 2018 Dec 30, 2018 - 04:20 PM GMTBy: Gary_Tanashian

Cyclical Assets vs. Gold
 In January of 2018 we noted a cyclical leader (Semiconductor Fab Equipment) in trouble: Semi Canary Still Chirping, But He’s Gonna Croak in 2018.
We also ran a series of articles featuring the happy-go-lucky 3 Amigos (of the macro) in order to gauge a point when larger herds of investors would become aware of cyclical issues facing the global (including the US) economy. Each Amigo (SPX/Gold Ratio, Long-term Treasury yields and a flattening Yield Curve) would ride with the good times but signal an end to those good times when reaching destination (Amigos 1 & 2 got home but #3, the Yield Curve is still out there). Here is the latest Amigos status update from October: SPX/Gold, 30yr Yields & Yield Curve.
Today I would like to stick with a cyclical macro view, but do so through a lens filtered by the ultimate counter-cyclical asset, gold. As market participants, we are lost if we do not have road maps. That is why we (NFTRH) gauged Semi Equipment vs. Semi (and Tech), the unified messages of the macro Amigo indicators and many other breadth and cyclical indicators along the way to safely guide us to Q4 2018, which has been a challenge for many, but business as usual for those of us who were prepared.
But gold, which all too often gets tied up in an ‘inflation protection’ pitch by commodity bulls, is one of the best signalers of a counter-cyclical backdrop as its best characteristic is that of value retention and capital preservation. Gold, being outside the constellation of risk ‘on’ assets does not pay any income, does not leverage good economic times and does not inherently involve risk because it is a marker of stable value. Hence its under performance during cyclical good times (leverage and all) and its out performance during troubled counter-cyclical times.
So let’s take an updated look at gold vs. various cyclical items as we close out 2018, a year we began on alert (after a “bull killer” upside melt up played out in January), forecast and managed a summer upside grind to test the top (typical of markets, SPX went higher than originally expected) and rode with the Amigos to a blessed Q4 crack in the macro.
These charts are not meant to imply an outcome for 2019, as we have a few viable scenarios for stocks, precious metals and markets in general (to be refined based on incoming information). The charts are simply a snapshot of today, for you (assuming you, like me, depend on such macro indicators) to gauge the macro. Let’s use weekly charts to get a more filtered, less noisy view of the proceedings.
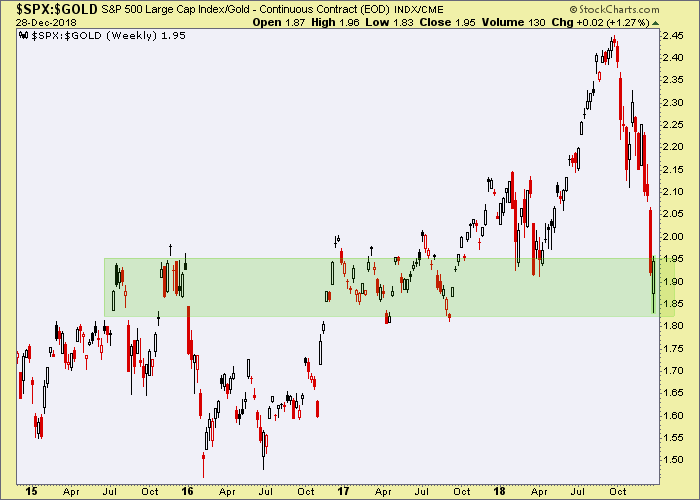
SPX/Gold (AKA Amigo #1) has dropped right into the area that was originally expected to provide support. This was actually equivalent to the anticipated ‘take back’ of the entire Trump rally from Q4 2016. Many indicators and nominal markets/sectors have already taken back the rally, while the nominal S&P 500 has not (yet) quite gotten there.
Regardless, the ratio hit our upside target (ref. the above-linked Amigos update and the monthly chart of SPX/Gold) and dropped like a stone. Perfect. Now, if relief is going to come to the macro, the noted support area should hold.
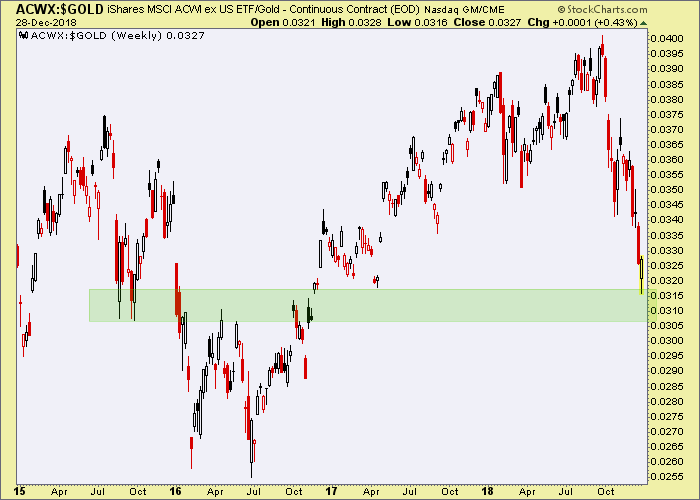
The World (ex-US) iShares (ACWX)/Gold ratio has also dropped to the equivalent of an area that nominal ACWX is expected to find support at.
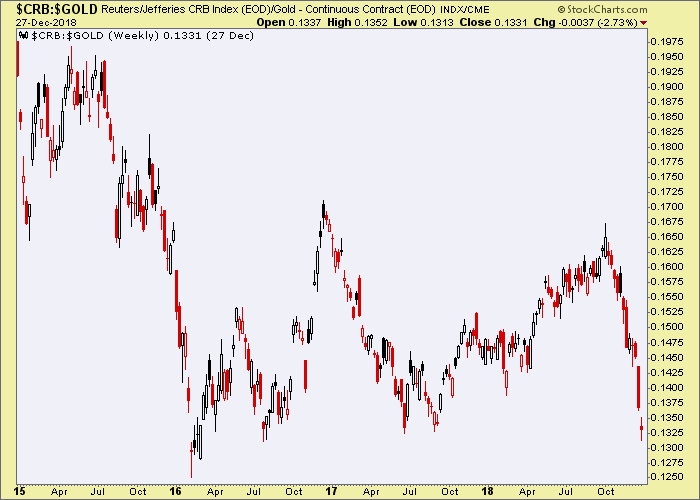
The CRB/Gold ratio has really gone in the tank right along with inflation expectations, as anticipated. Commodities are cyclical and a healthy global economy would see them rising in relation to the value anchor. It’s not happening. CRB/Gold is testing the Q1 2016 low from which the most recent ‘inflation trade’ began.
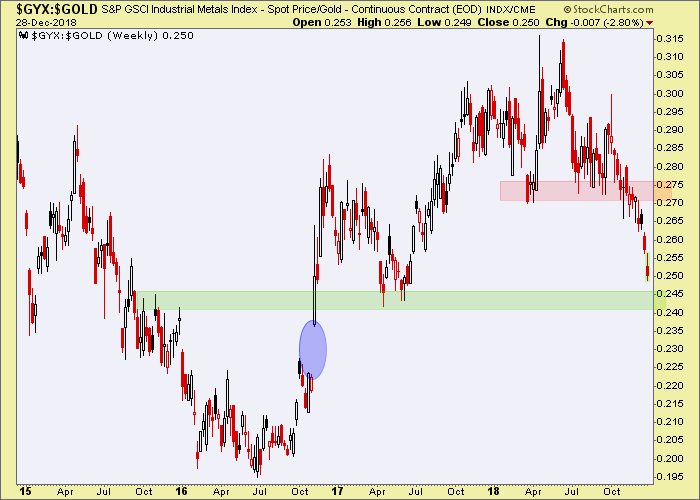
Looking within the commodity complex the GYX (Industrial Metals)/Gold ratio is dropping hard. The IMs are highly cyclical and as you can see they gapped upward vs. gold in Q4 2016 upon the election of a 70s style, fiscal reflation-bent president. Walls, infrastructure and commercial buildings need base metals and materials after all. If the macro is going to find short-term relief, the green shaded zone looks like a good spot for it to do so. But don’t be surprised if the entire fantasy is closed out in 2019 with the closing of the noted (blue) gap.
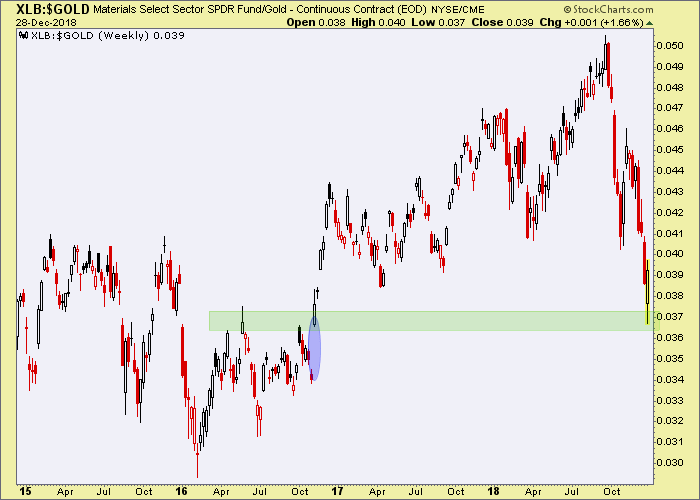
Speaking of Materials, I like to view the US Materials sector vs. Gold as well. Here we are at a possible relief point, but Materials being a primary ‘Trump Trade’ we can watch for the gap to close in 2019.
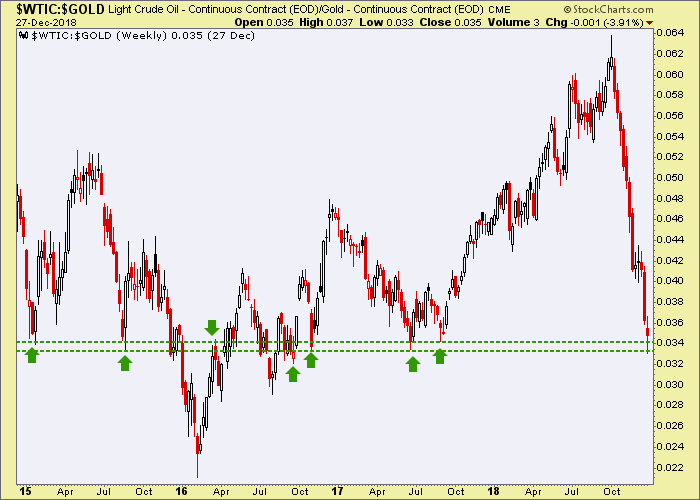
WTIC/Gold ratio is one I have written a lot about lately (actually, we’ve repeatedly noted it flipped over as a bullish Gold/Oil ratio), in helping prepare subscribers (and myself) for a phase of bullish gold mining fundamentals. As far back as November 4th we were on the bullish case.
As you can see, if the ratio is going to bounce now would be a likely time. Nothing sustainable goes straight up or down. NFTRH was on this case from the beginning and the ratio has since made our point. Now it can bounce along with some macro relief.
 /
/
Bottom Line
There are many other useful ratios and macro indicators, involving gold and otherwise. But the above give a useful view telling us that a potential area for at least temporary relief is at hand for cyclical macro markets. In other words, initial downside targets are in as measured in gold.
We have anticipated a stock market bounce, which is finally here. It appears a likely time that other cyclical asset ratios can bounce as well, unless inflation really is dead and buried.
Subscribe to NFTRH Premium (monthly at USD $33.50 or a 14% discounted yearly at USD $345.00) for an in-depth weekly market report, interim market updates and NFTRH+ chart and trade setup ideas, all archived/posted at the site and delivered to your inbox.
You can also keep up to date with plenty of actionable public content at NFTRH.com by using the email form on the right sidebar and get even more by joining our free eLetter. Or follow via Twitter ;@BiiwiiNFTRH, StockTwits or RSS. Also check out the quality market writers at Biiwii.com.
By Gary Tanashian
© 2018 Copyright Gary Tanashian - All Rights Reserved
Disclaimer: The above is a matter of opinion provided for general information purposes only and is not intended as investment advice. Information and analysis above are derived from sources and utilising methods believed to be reliable, but we cannot accept responsibility for any losses you may incur as a result of this analysis. Individuals should consult with their personal financial advisors.
Gary Tanashian Archive |
© 2005-2022 http://www.MarketOracle.co.uk - The Market Oracle is a FREE Daily Financial Markets Analysis & Forecasting online publication.