


GBP/USD - Has the Hope of the Bulls Gone?
Currencies / British Pound Dec 28, 2018 - 02:28 PM GMTBy: Nadia_Simmons

Monday's session brought a breakout above the upper border of the consolidation and hope for higher values of GBP/USD. Unfortunately, none of these things lasted too long as the next days showed that the bears are not going to let their rivals through to the north without a fight. What are the implications of the recent price action?
EUR/USD – Breakthrough? Not yet.
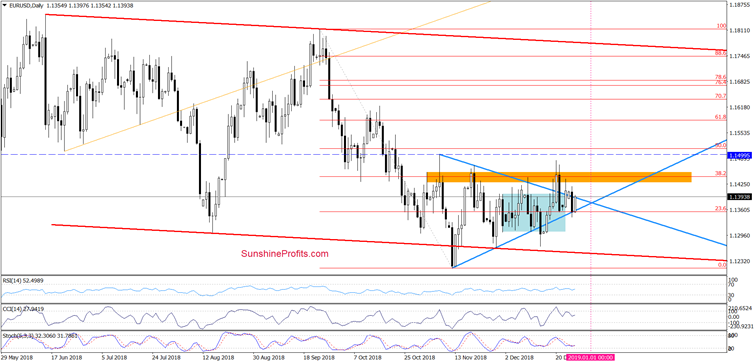
Looking at the daily chart, we see that the overall situation hasn’t changed much as EUR/USD is still trading in a narrow range between the previously-broken orange resistance zone and the lower border of the blue triangle.
Despite the fact that both sides of the market tried to tip the scales of victory on their side during yesterday's session, neither currency bulls nor the bears could close the day above/below the upper/lower border of the blue triangle.
As a result, the pair closed the day inside the formation, which suggests that unless we see an effective breakout above the orange resistance zone or breakdown below the lower line of the triangle (and preferably below the low tit in mid-December) the next bigger move is unlikely and short-lived moves in both directions should not surprise us.
Nevertheless, finishing today’s commentary on EUR/USD, we would like to draw your attention to the above-mentioned triangle, but this time from a slightly different perspective. What do we mean by that?
As you can see on the chart the space for movements between the arms of the formation is narrowing more and more, which means that one of the sides (the buyers or the sellers) will finally emerge victorious from this tiring duel.
When will it happen? The intersection of arms of the triangle will take place at the beginning of the next year, which means that both Monday and Wednesday sessions may indicate the place where the reversal will take place - according to the Triangle Apex Reversal technique.
Depending on where this happens, we will take further investment decisions. In other words, if the bulls push the currency pair above the orange resistance zone and fail to keep the EUR/USD above this resistance once again, we will consider the opening short positions.
On the other hand, if bears fail and they cannot effectively maintain the exchange rate below the lower border of the triangle, the probability of the next move towards the north will increase significantly. We will keep our subscribers informed should anything change, or should we see a confirmation/invalidation of the above.
GBP/USD – More of the Same – For Now.
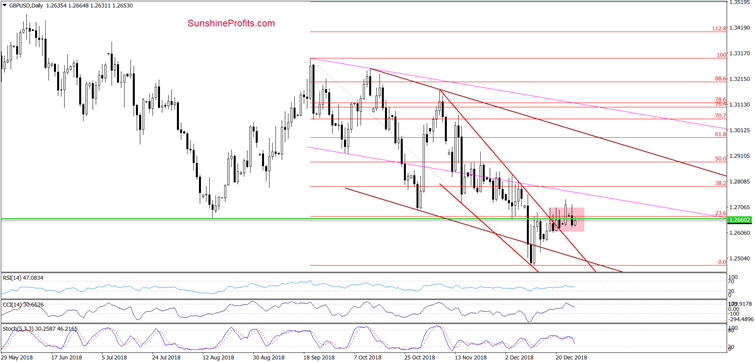
The first thing that caches the eye on the daily chart is Monday’s breakout above the upper border of the pink consolidation. Although this was a positive development, it didn’t last long because GBP/USD opened the next day much lower, invalidating the earlier breakout.
Yesterday, currency bulls tried to save the situation and pushed the currency pair higher once again, but it soon turned out that the area above the consolidation is inhabited by vigilant bears that pushed GBP/USD south in the following hours, invalidating the earlier tiny breakout for the second time in a row. Thanks to yesterday’s drop, the pair also closed the day under the green horizontal line, which also means an invalidation of the breakout above it (a bearish development).
Earlier today, the bulls have mobilized to fight for higher values of GBP/USD once again, but until we see a daily closure above the consolidation and the strength of the bulls (such as a continuation of the upward move instead of shifting back into the formation) the technical situation favors the sellers - especially when we take into account the sell signals generated by CCI and the Stochastic Oscillator and the situation in the medium term.
And since we have already mentioned it, let's analyze the chart below and check how the above price action influenced the weekly chart.
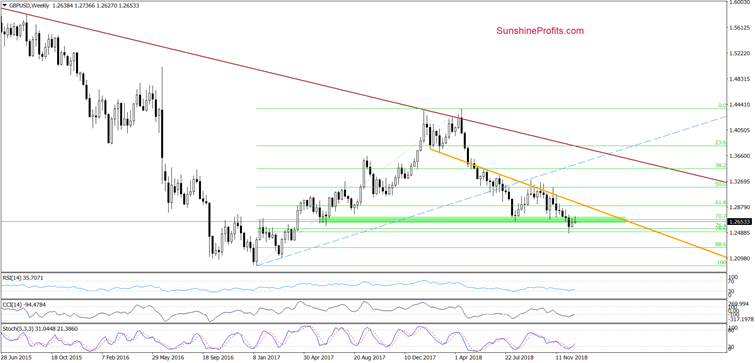
From this perspective, we see that although GBP/USD extended gains earlier this week, the overall situation in the medium term hasn’t changed much as GBP/USD is still trading under the green zone, which continues to serve as the nearest resistance.
What does it mean for the exchange rate?
In our opinion, a reversal and another move to the downside. If this is the case, we’ll see a test of the lower border of the consolidation in the very near future. However, if it is broken, the next target fore the sellers will be the previously-broken upper border of the red declining trend channel (currently at around 1.2547) or even the lower line of the brown declining trend channel and the mid-December lows.
AUD/USD – Double Bottom or Further Declines?
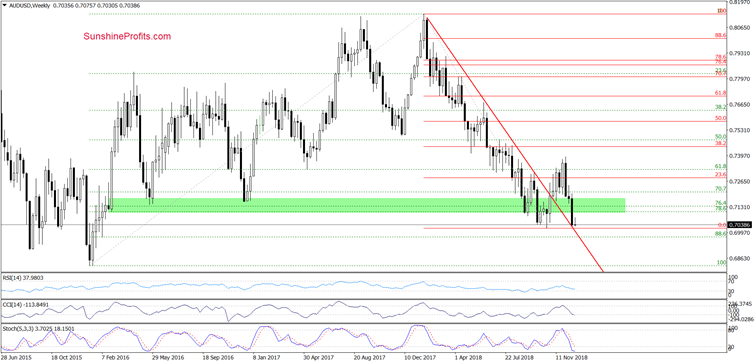
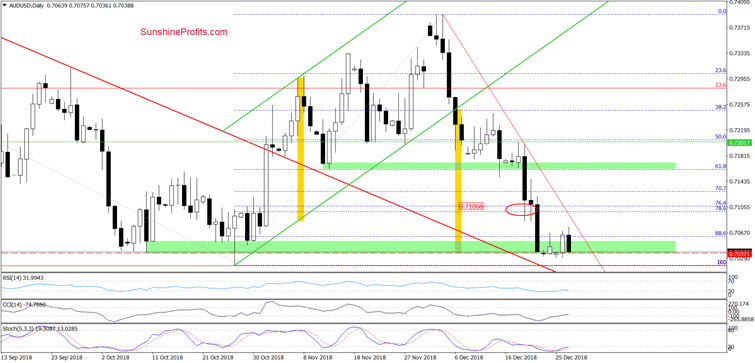
On Friday, we wrote the following:
(…) How low can this currency pair fall?
Taking into account the breakdown under the lower border of the green rising trend channel, we think that currency bears can push the exchange rate even to around 0.7037, where the size of the downward move will correspond to the height of the formation (we marked these ranges with yellow rectangles).
What’s interesting, this is also the lower border of the nearest green support zone based on the early- and late-October lows, which suggests that currency pair may rebound from this region at the beginning of next week - especially when we factor in the current level of daily indicators (they are oversold and we can notice a bullish divergence between the Stochastic Oscillator and AUD/USD) and the proximity to the previous important low (the last 2018 low hit in October) and the upper border of the red declining trend channel broken in early November.
From today’s point of view, we see that the situation developed in tune with our assumptions and AUD/USD moved a bit higher after the last week’s decline to the downside target.
Unfortunately, looking at the size of the rebound, it's hard to believe in the currency bulls’ strength and their determination to fight for higher levels. This manifestation of weakness was also noticed by the bears, who took the currency pair lower earlier today.
As a result, AUD/USD approached the last week’s lows, which could translate into another rebound. However, in our opinion, the layout of the entire recent downward move (begun in mid-December) suggests that one more downswing and a drop to the October 26 low or even the previously-broken red declining line may still be ahead of us.
Nevertheless, the current position of the daily indicators indicates that the space for declines is limited and a reversal may be just around the corner (maybe we will see it at the same time as in the case of EUR / USD).
If you enjoyed the above analysis and would like to receive free follow-ups, we encourage you to sign up for our daily newsletter – it’s free and if you don’t like it, you can unsubscribe with just 2 clicks. If you sign up today, you’ll also get 7 days of free access to our premium daily Oil Trading Alerts as well as Gold & Silver Trading Alerts. Sign up now.
Nadia Simmons
Forex & Oil Trading Strategist
Przemyslaw Radomski
Founder, Editor-in-chief
Sunshine Profits: Gold & Silver, Forex, Bitcoin, Crude Oil & Stocks
Stay updated: sign up for our free mailing list today
* * * * *
Disclaimer
All essays, research and information found above represent analyses and opinions of Nadia Simmons and Sunshine Profits' associates only. As such, it may prove wrong and be a subject to change without notice. Opinions and analyses were based on data available to authors of respective essays at the time of writing. Although the information provided above is based on careful research and sources that are believed to be accurate, Nadia Simmons and his associates do not guarantee the accuracy or thoroughness of the data or information reported. The opinions published above are neither an offer nor a recommendation to purchase or sell any securities. Nadia Simmons is not a Registered Securities Advisor. By reading Nadia Simmons’ reports you fully agree that he will not be held responsible or liable for any decisions you make regarding any information provided in these reports. Investing, trading and speculation in any financial markets may involve high risk of loss. Nadia Simmons, Sunshine Profits' employees and affiliates as well as members of their families may have a short or long position in any securities, including those mentioned in any of the reports or essays, and may make additional purchases and/or sales of those securities without notice.
Nadia Simmons Archive |
© 2005-2022 http://www.MarketOracle.co.uk - The Market Oracle is a FREE Daily Financial Markets Analysis & Forecasting online publication.