


Where is the Stock Market Santa Claus Rally?
Stock-Markets / Stock Markets 2018 Dec 12, 2018 - 04:43 PM GMTBy: Troy_Bombardia

With the S&P 500 down so far in December, some investors and traders are asking “where’s the Santa Claus Rally”?
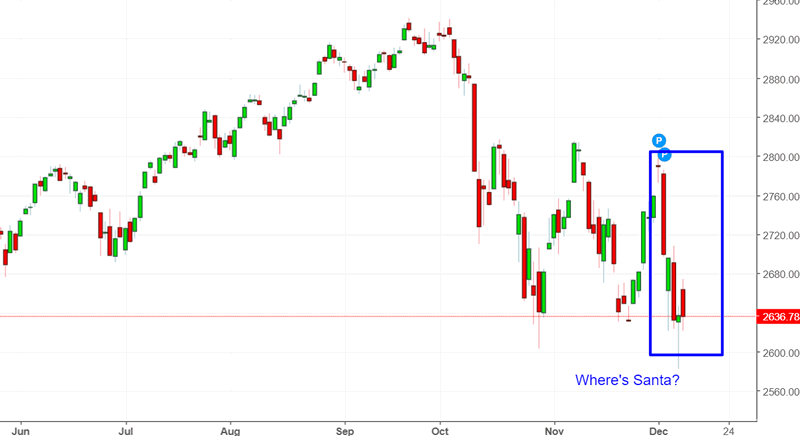
But as I explained in our comprehensive guide to the stock market’s seasonality, the stock market doesn’t always go up in December (even though December is historically the stock market’s best month). Seasonality factors are of secondary importance.
Go here to understand our fundamentals-driven long term outlook.
Let’s determine the stock market’s most probable medium term direction by objectively quantifying technical analysis. For reference, here’s the random probability of the U.S. stock market going up on any given day, week, or month.

*Probability ≠ certainty. Past performance ≠ future performance. But if you don’t use the past as a guide, you are walking blindly into the future.
Drawdown in December
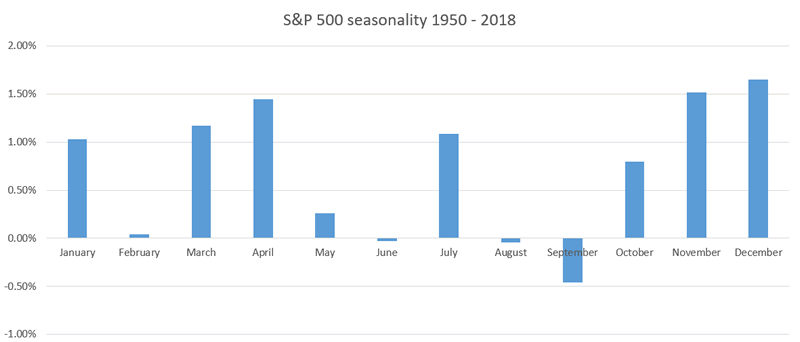
December is usually the stock market’s best month of the year.
That’s why it’s uncommon for the S&P to have a drawdown of more than -6% in December.
Here’s what happened next to the S&P 500 (after December) when it fell more than -6% at any point in December from November’s close.
*Data from 1900 – present
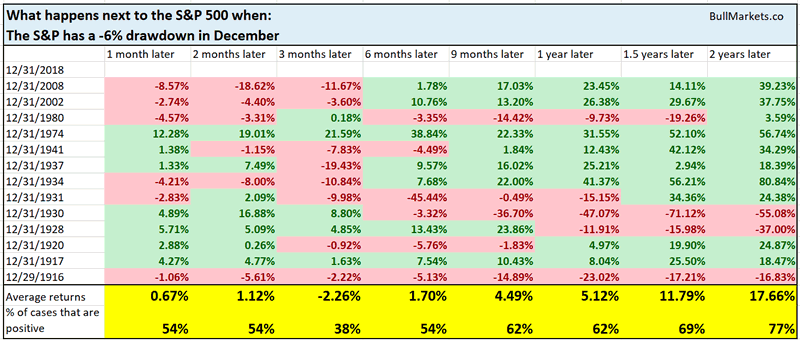
Interestingly enough, there’s a bearish lean 3 months later. What’s even more interesting is that most of the bearish cases happened from 1916-1941. This demonstrates
how seasonality changes over the decades. Before WWII, May – October was the best half year, whereas after WWII, November – April was the best half year.
Some big daily swings
The stock market is making massive intraday swings right now. As of December 10, there have been 4 consecutive days in which the daily LOW was more than -1.7% below the previous day’s CLOSE.
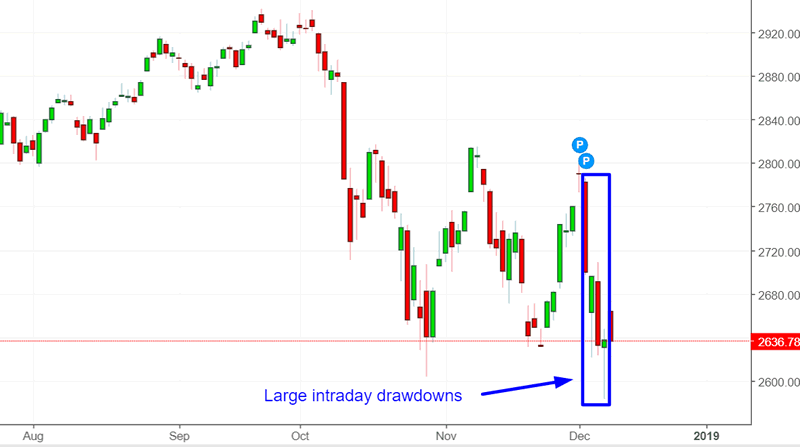
Some traders see this as a sign of “rare capitulation selling”. Is it?
Here’s what happened next to the S&P 500 (historically) when there were 4 consecutive days in which the daily LOW was more than -1.7% below the previous day’s CLOSE.
*Data from 1928 – present
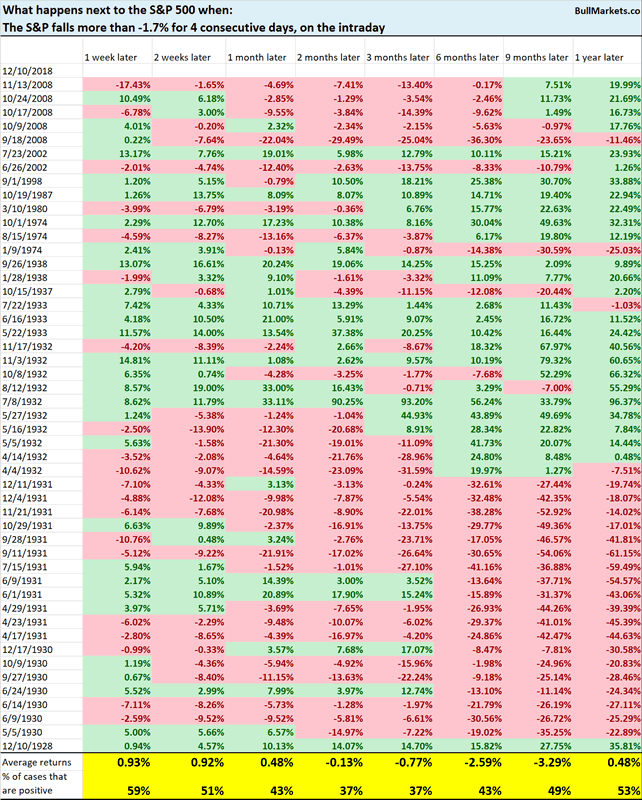
On the surface, this seems medium term bearish for the stock market.
However, you can see that many of the cases happened from 1930 – 1932, AFTER the stock market had already collapsed more than 50%. Context matters, and the context back then is very different than today.
Let’s examine the cases in which the S&P was within 20% of a 2 year high.
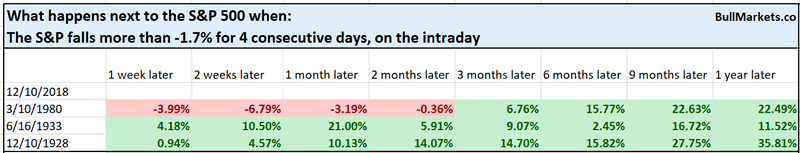
n = 3, but at least this isn’t a medium term bearish sign for the stock market.
Small caps’ rapid decline
Small caps (Russell 2000) continues to be the weakest sector, down more than -18%
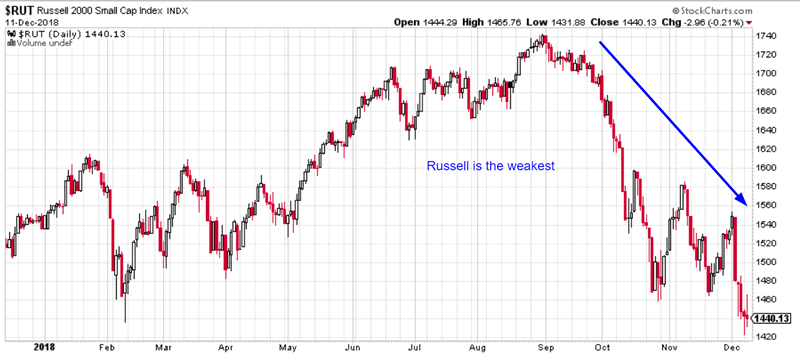
This is quite a rapid decline.
Here’s what happened next to the Russell when it fell more than -18% in 70 days or less from a 2 year high.
*Data from 1980 – present
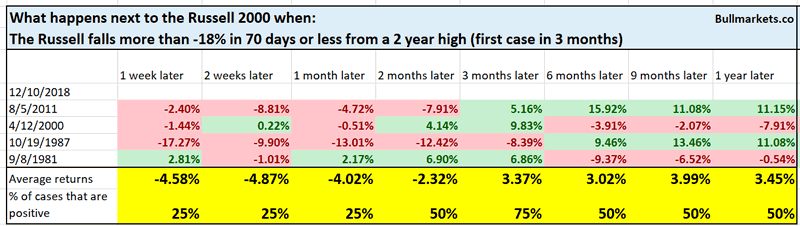
This is not bullish for the Russell over the next 1 month.
XLU
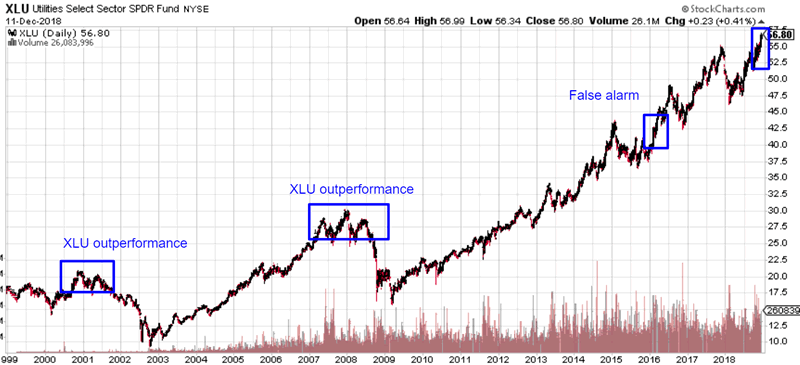
Defensive sectors (XLU – utilites) continue to outperform while the stock market struggles.
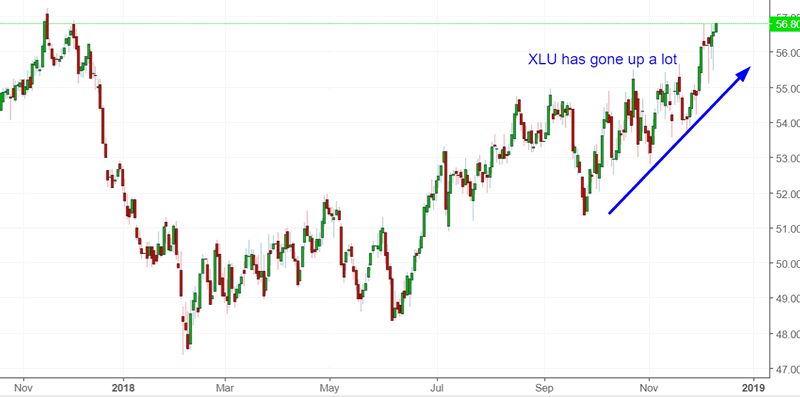
We have highlighted this recently in our market studies, and it is typically a late-cycle sign. XLU tends to outperform towards the end of a bull market.
Over the past 5 days, XLU has gone up every day while the S&P has gone down 4 of the past 5 days.
*Data from 1998 – present
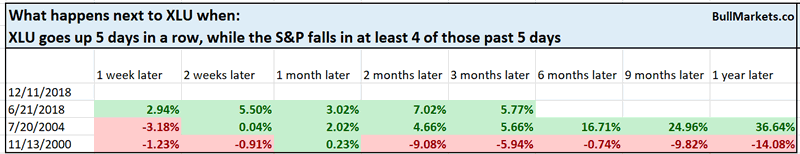
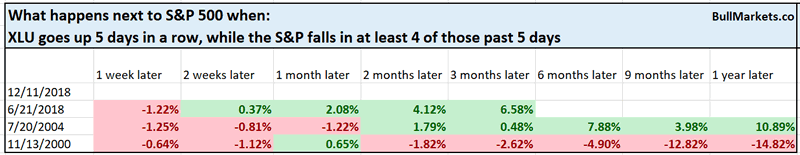
It’s interesting that in the worst case scenario (November 13, 2000), the stock market does ok over the next 1 month
n = 3, so take this with a grain of salt
Our market studies have been mixed recently, which highlights that towards the end of bull markets, fundamentals are more useful than technicals.
Click here for yesterday’s market studies
Conclusion
Here is our discretionary market outlook:
- For the first time since 2009, the U.S. stock market’s long term risk:reward is no longer bullish. This doesn’t necessarily mean that the bull market is over. We’re merely talking about long term risk:reward.
- The medium term direction is still bullish (i.e. trend for the next 6-9 months)
- The short term is a 50/50 bet
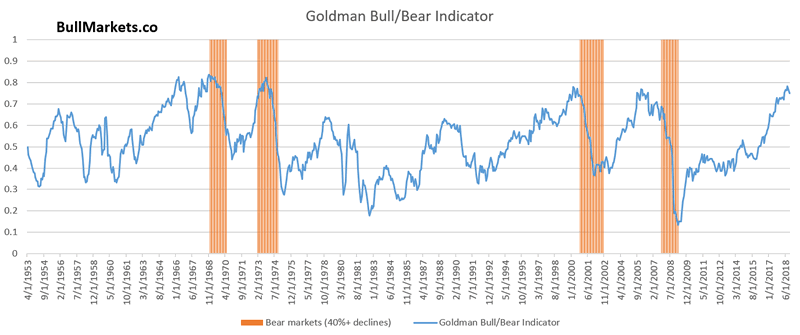
Goldman Sachs’ Bull/Bear Indicator demonstrates that while the bull market’s top isn’t necessarily in, risk:reward does favor long term bears.
Our discretionary outlook is not a reflection of how we’re trading the markets right now. We trade based on our clear, quantitative trading models, such as the Medium-Long Term Model.
Members can see exactly how we’re trading the U.S. stock market right now based on our trading models.
Click here for more market studies
By Troy Bombardia
I’m Troy Bombardia, the author behind BullMarkets.co. I used to run a hedge fund, but closed it due to a major health scare. I am now enjoying life and simply investing/trading my own account. I focus on long term performance and ignore short term performance.
Copyright 2018 © Troy Bombardia - All Rights Reserved
Disclaimer: The above is a matter of opinion provided for general information purposes only and is not intended as investment advice. Information and analysis above are derived from sources and utilising methods believed to be reliable, but we cannot accept responsibility for any losses you may incur as a result of this analysis. Individuals should consult with their personal financial advisors.
© 2005-2022 http://www.MarketOracle.co.uk - The Market Oracle is a FREE Daily Financial Markets Analysis & Forecasting online publication.