


The Stock Market’s Long Term Outlook is Changing
Stock-Markets / Stock Markets 2018 Dec 10, 2018 - 04:18 AM GMTBy: Troy_Bombardia

As I explained in today’s special report, our Macro Investing Index has been deteriorating since August/September 2018. This stands in sharp contrast with the 10% correction from this January – February 2018, when the U.S. macro economy was healthy.
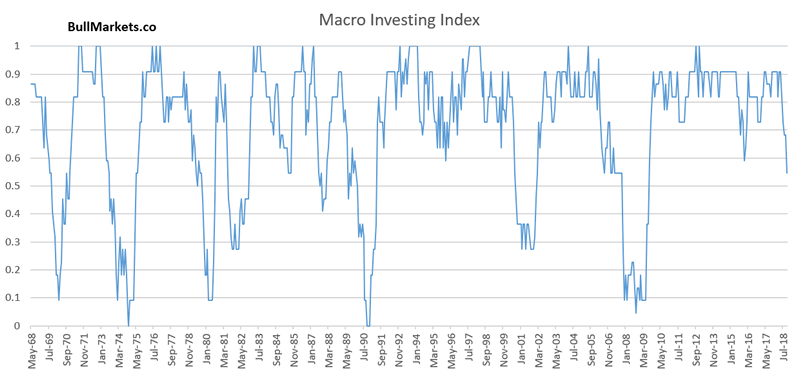
This is typical late-cycle behavior, and signals that the long term risk:reward no longer favors bulls. It now favors the bears, as I discussed here. Hence, we are now no longer long term bullish on the U.S. stock market for the first time since March 2009.
*The Macro Investing Model is a new model that we just developed and will be used in our trading. The Macro Investing Model does not try to pick exact bull market tops. It determines long term risk:reward.
The economy’s fundamentals determine the stock market’s medium-long term outlook. Technicals determine the stock market’s short-medium term outlook. Here’s why:
- The stock market’s long term risk:reward is no longer bullish.
- The stock market’s medium term leans bullish (i.e. next 6-9 months).
- The stock market’s short term is mostly a 50-50 bet.
We focus on the medium and long term. Let’s go from the long term, to the medium term, to the short term.
Long Term
While the bull market could very well still last until Q2 2019, the long term risk:reward no longer favors bulls. Past a certain point, risk:reward is more important than the stock market’s most probable direction.
Some leading indicators are showing signs of deterioration. The usual chain of events looks like this:
- Housing – the earliest leading indicators – starts to deteriorate. Meanwhile, the U.S. stock market is still in a bull market while the rest of the U.S. economy improves. The rally gets choppy, with volatile corrections along the way.
- The labor market starts to deteriorate. Meanwhile, the U.S. stock market is still in a bull market. This will likely happen in the start of 2019. We are almost here right now.
- The labor market deteriorates some more, while other economic indicators start to deteriorate. The stock market tops, and the bull market is over.
Let’s look at the data (aside from our Macro Investing Index).
The earliest leading economic indicators – housing – have been deteriorating since August/September 2018.
For example, Housing Months of Supply is trending upwards. This figure typically trends upwards before recessions and bear markets begin.
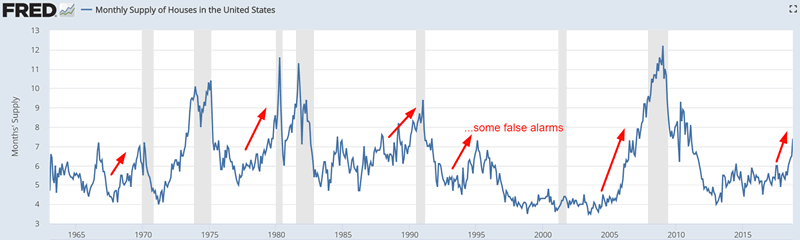
Source: FRED
Meanwhile, Initial Claims is trending sideways/upwards right now and Continued Claims will likely start to trend sideways over the next few months. Watch out over the next several months if Initial Claims starts to clearly trend upwards.
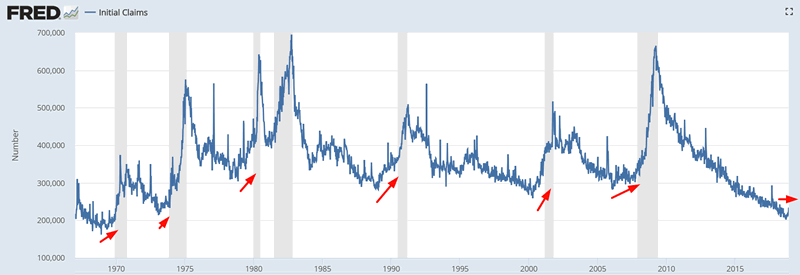
FRED
The widely watched 10 year – 2 year yield curve is very close to inverting, and will most likely invert within the next month (currently at 0.15%)
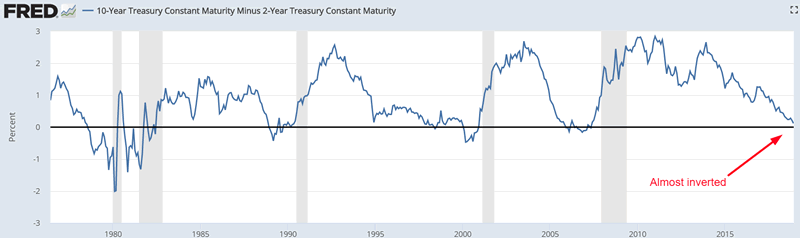
Source: FRED
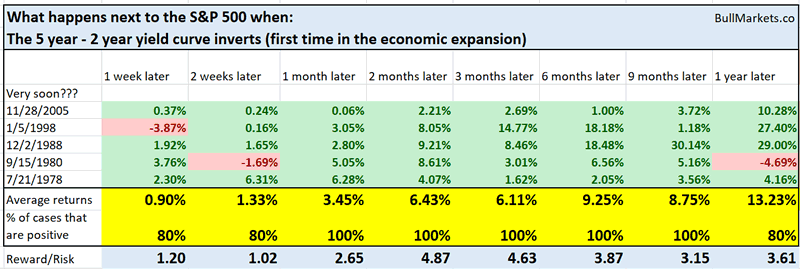
*The 5 year – 2 year yield curve inverted this week. Contrary to popular belief, the stock market tends to go up after the 5 year – 2 year yield curve inverts.
Meanwhile, Unit Profits have been trending down for 4 years. This is not a timing indicator because it has a long lead time. It can trend downwards for years before bear markets and recessions start. But either way, this does suggest that we are in the late-stages of this economic expansion and bull market.
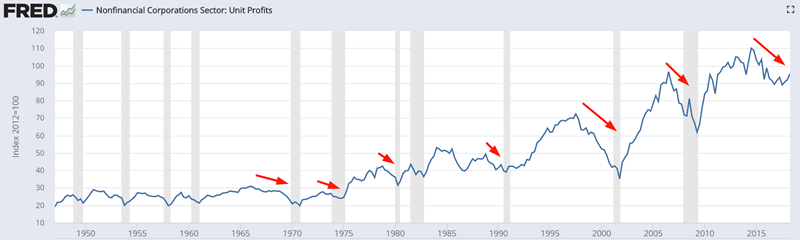
Source: Yardeni
Consumer Confidence remains very high, which is another late-cycle sign.
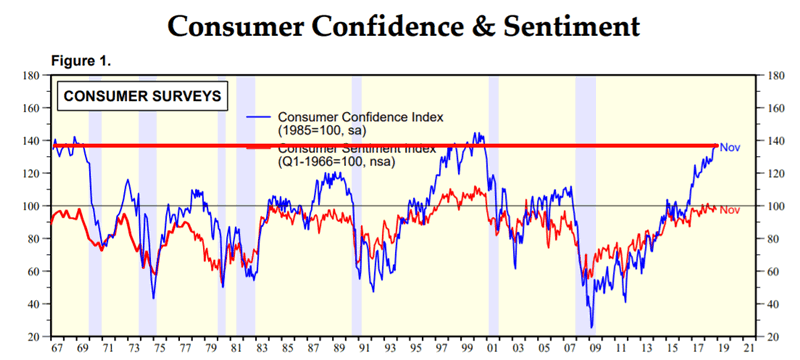
Source: Ed Yardeni
It’s also important to note that Net Earnings Revisions has finally turned negative for the first time in 2 years. This is a necessary but not sufficient condition for bear markets because this tends to turn negative before bear markets begin (with many false signals).
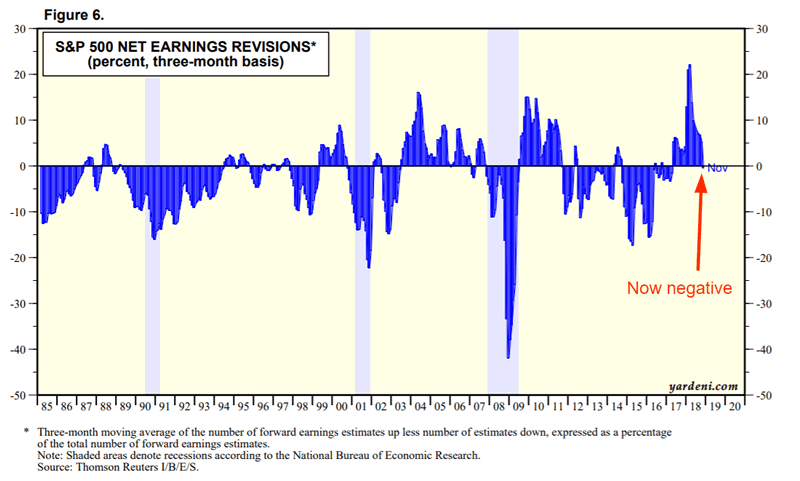
Source: yardeni
However, not all leading indicators are showing economic deterioration, which is typically what happens as we get closer and closer to the bull market’s top. The economic data becomes mixed, with some leading indicators still bullish while others are bearish.
For example, Capacity Utilization is still trending upwards. Historically, this indicator trended sideways or downwards before bear markets and recessiongs began.
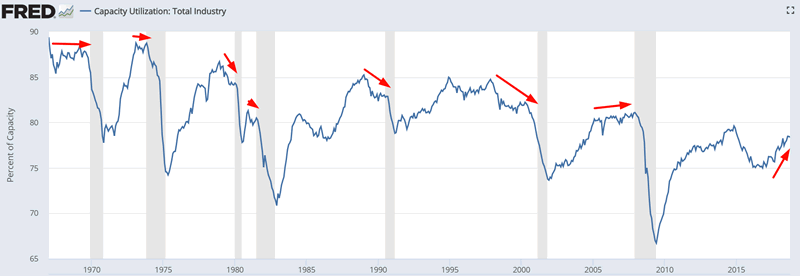
Source: FRED
Similarly, Personal Consumption Expenditures growth has yet to fall. This figure tends to trend downwards before bear markets and recessions begin.
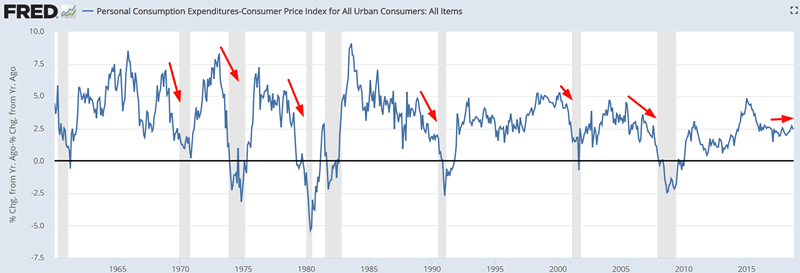
Source: FRED
Financial conditions are still very loose despite the stock market’s current decline. The Chicago Fed’s Financial Conditions Index is trending downwards. This figure tends to trend upwards before bear markets and recessions begin.
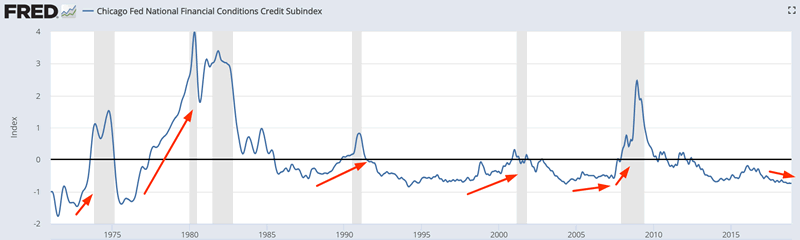
Source: FRED
Medium Term
Our medium term outlook (next 6 months) still leans bullish.
*For reference, here’s the random probability of the U.S. stock market going up on any given day, week, or month.

Volatility is usually mean-reverting.
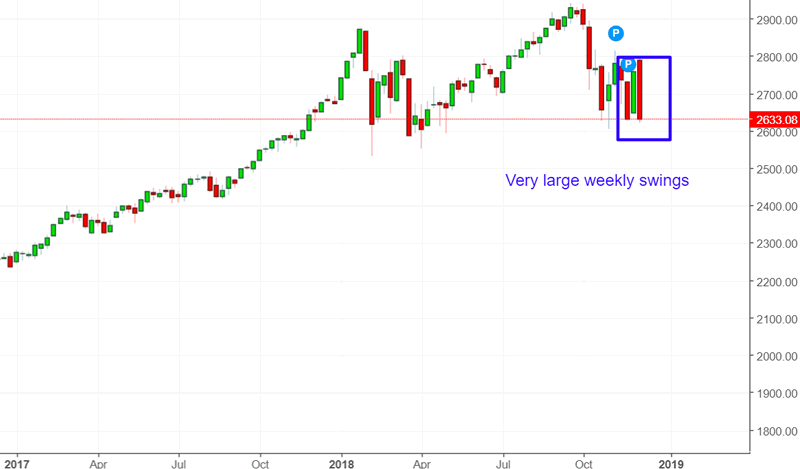
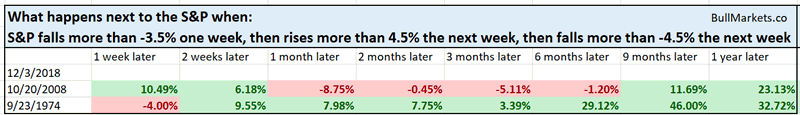
The past 3 weeks have been crazy. The S&P fell more than -3.5% one week, then went up more than 4.5% the next week, and then fell more than -4.5% this week.
Historically, such a pattern has only happened 2 other times from 1950 – present. Here’s what the S&P 500 did next.
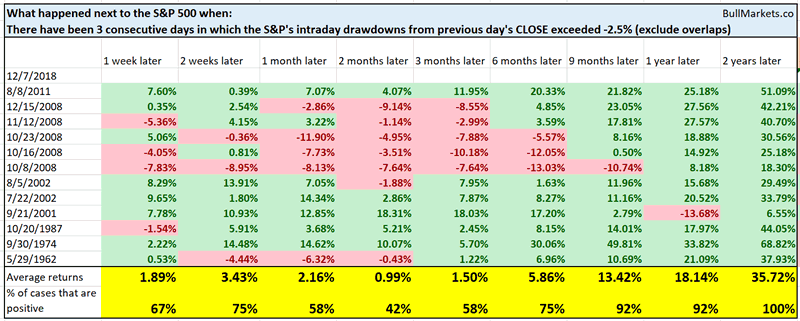
As of Friday, the S&P experienced 3 consecutive days in which its intraday drawdown from the previous day’s CLOSE exceed -2.5%.
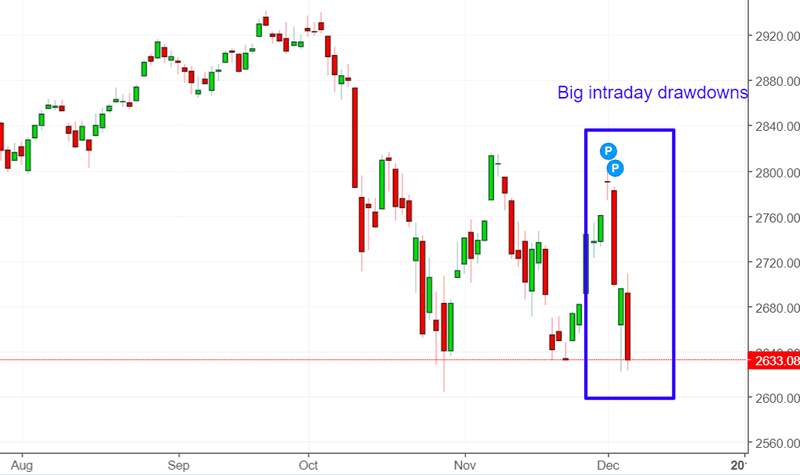
Historically, such a pattern was bullish for the stock market 9+ months later.
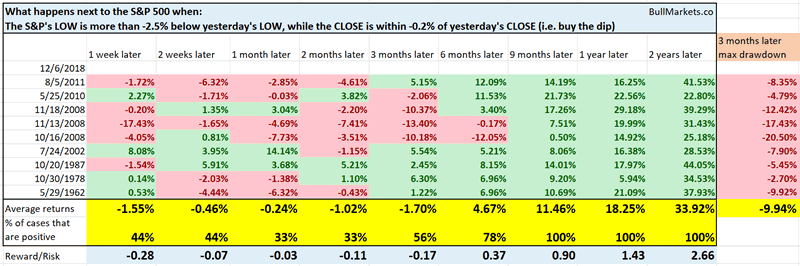
There was an intense “buy the dip” mentality on Thursday. The S&P’s LOW was more than -2.5% below Wednesday’s LOW, while the CLOSE was within -0.2% of Wednesday’s CLOSE.
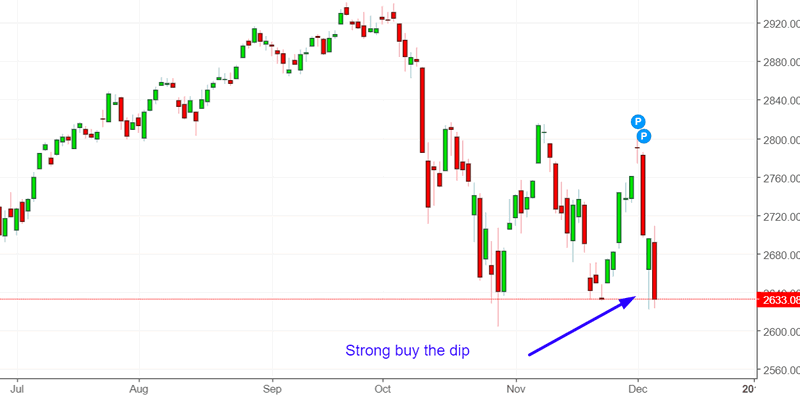
Historically, this was consistently bullish 9+ months later.
The S&P fell more than -3% on Wednesday. Such big “down days” are rare in December, because a lot of investors and traders anticipate the Santa Claus Rally.
Here’s every single -3% decline in a December from 1927 – present, and what the stock market did next
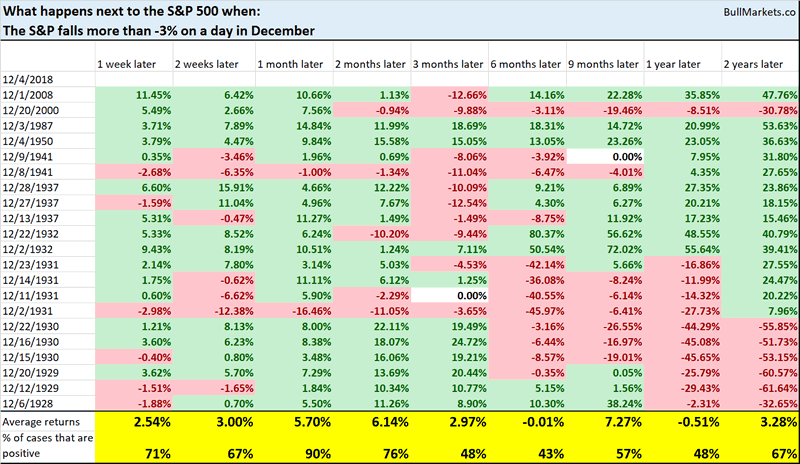
Remarkably, the stock market was up 90% of the time 1 month later. So perhaps the Santa Claus Rally will appear after all?
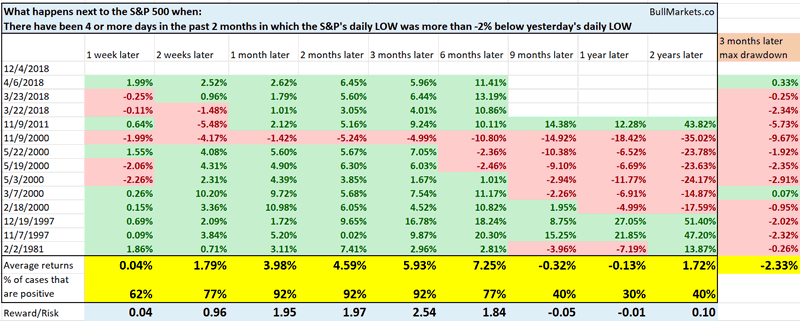
And as of Thursday, the S&P had experienced 4 days in the past 2 months in which the S&P’s daily LOW was more than -2% below yesterday’s daily LOW.
Historically, this was bullish for the stock market 1-3 months later.
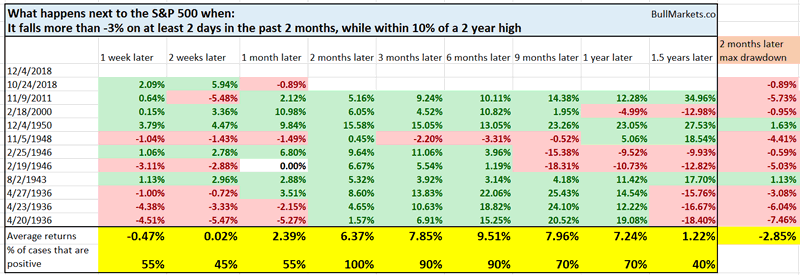
As of Tuesday, the S&P has fallen more than -3% in at least 2 days in the past 2 months.
Historically, this always led to a stock market rally over the next 2 months, even if there was more short term weakness.
So as you can see, all these ways of measuring “high volatility” demonstrate that high volatility is mean reverting.
But here’s the interesting point. Many of these extreme volatility cases happened AFTER the S&P fell more than -40%. In other words, a very different context than today. This suggests that short term volatility has increased over time, which possibly means that mean-reversion volatility studies are less useful than they were in the past.
Anyways, the key point is that fundamentals are more useful than technicals. Technical price action changes over time, whereas fundamental principles are timeless and universal.
Short Term
The stock market’s short term is mostly a 50-50 bet right now, as it is most of the time.
Conclusion
Here is our discretionary market outlook:
- The stock market’s long term risk:reward favors the bears. The bull market is in a topping process.
- The stock market’s medium term outlook leans bullish
- The short term is a 50/50 bet
Our discretionary outlook is not a reflection of how we’re trading the markets right now. We trade based on our clear, quantitative trading models, such as the Medium-Long Term Model.
Members can see exactly how we’re trading the U.S. stock market right now based on our trading models.
Click here for more market studies
By Troy Bombardia
I’m Troy Bombardia, the author behind BullMarkets.co. I used to run a hedge fund, but closed it due to a major health scare. I am now enjoying life and simply investing/trading my own account. I focus on long term performance and ignore short term performance.
Copyright 2018 © Troy Bombardia - All Rights Reserved
Disclaimer: The above is a matter of opinion provided for general information purposes only and is not intended as investment advice. Information and analysis above are derived from sources and utilising methods believed to be reliable, but we cannot accept responsibility for any losses you may incur as a result of this analysis. Individuals should consult with their personal financial advisors.
© 2005-2022 http://www.MarketOracle.co.uk - The Market Oracle is a FREE Daily Financial Markets Analysis & Forecasting online publication.