


Stock Market Crashed While the Yield Curve Inverted
Stock-Markets / Stock Markets 2018 Dec 05, 2018 - 05:08 PM GMTBy: Troy_Bombardia

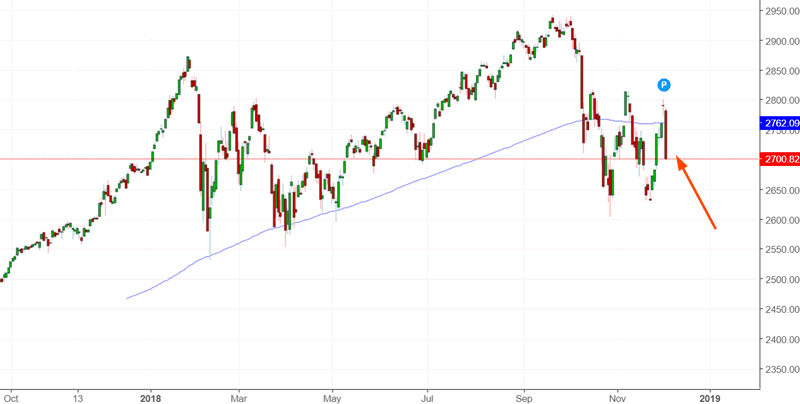
The stock market tanked -3% today as the yield curve started to invert.
Let’s determine the stock market’s most probable direction by objectively quantifying technical analysis. For reference, here’s the random probability of the U.S. stock market going up on any given day, week, or month.

*Probability ≠ certainty. Past performance ≠ future performance. But if you don’t use the past as a guide, you are walking into the future blindly.
Yield curve inversion
I have talked about the yield curve inversion several times over the past 2 weeks. And as expected, financial media is screaming “YIELD CURVE INVERSION!!!! RUN FOR THE HILLS!!!”
Let’s look at the data.
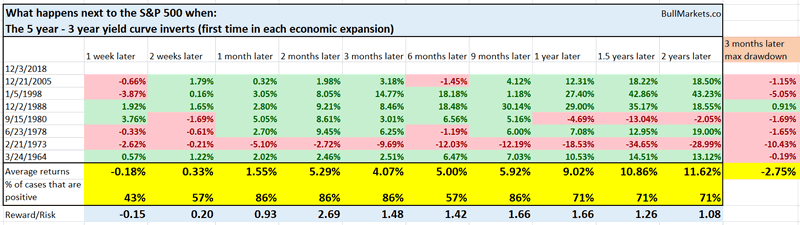
The 5 year – 3 year yield curve is the first yield curve to invert.
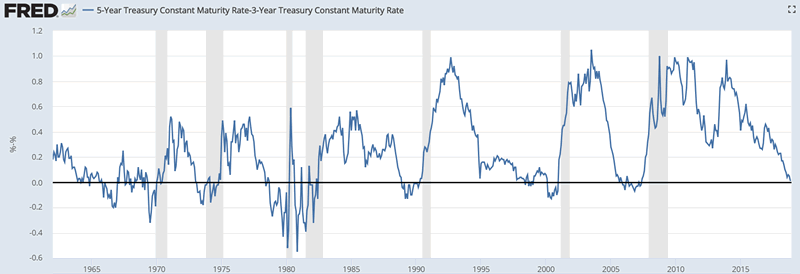
Here’s what the S&P 500 did next after the first inversion in each economic expansion.
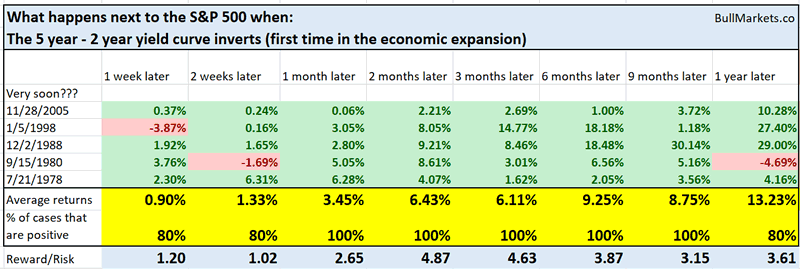
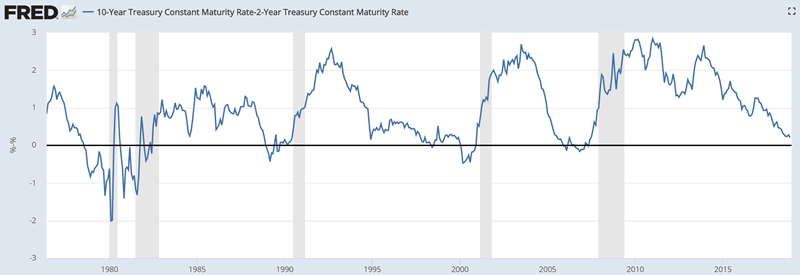
The next yield curve to invert will be the 5 year – 2 year yield curve. This will probably invert within the next few weeks.
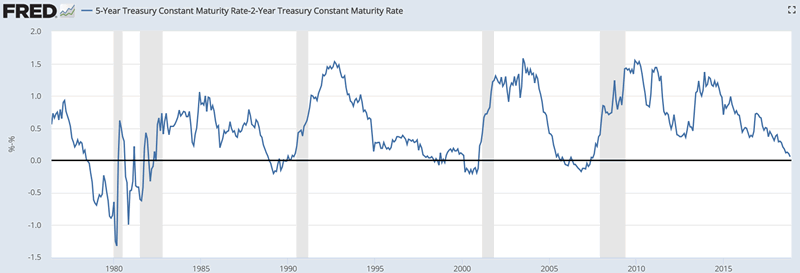
Here’s what the S&P 500 did next after the first inversion in each economic expansion.
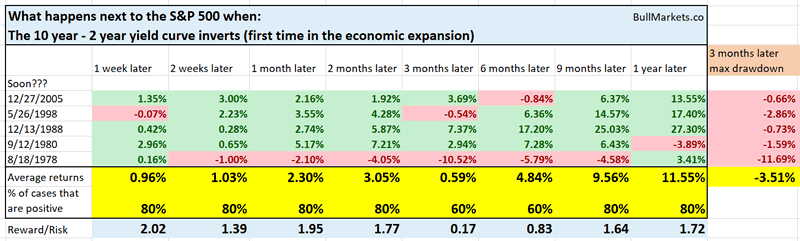
After that, the 10 year – 2 year yield curve will probably invert.
Here’s what the S&P 500 did next after the first inversion in each economic expansion.
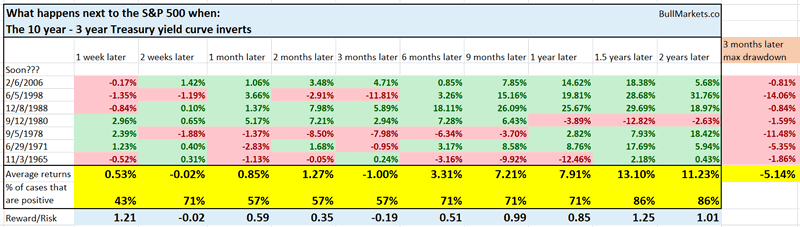
After that, the 10 year – 3 year yield curve will probably invert.
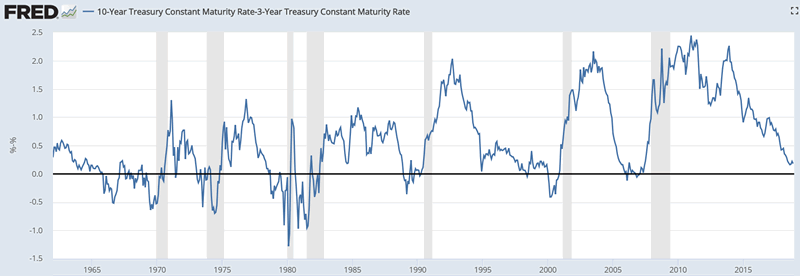
Here’s what the S&P 500 did next after the first inversion in each economic expansion.
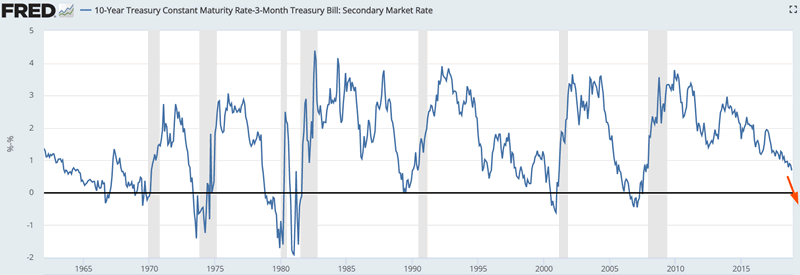
The last yield curve to invert will be the 10 year – 3 month yield curve. This is not likely to happen over the next few months.
Here’s what the S&P 500 did next after the first inversion in each economic expansion.
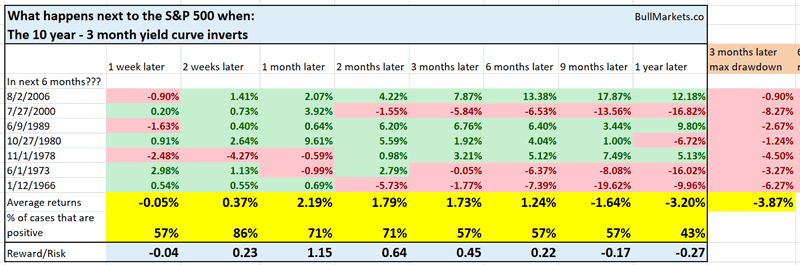
So what do you see?
The yield curve slowly inverts, one part at a time. This process has begun. The most timely yield curve is the 10 year – 3 months yield curve, and this is still a few months away from being inverted. The stock market is not consistently long term bearish until the last yield curve (10 years – 3 months) inverts.
This is why you should be careful when reading stuff from mainstream financial media. They love bearish headlines, because bearish headlines get 5x the number of clicks vs. bullish headlines. It’s good for their business.
Here’s the data to prove it.
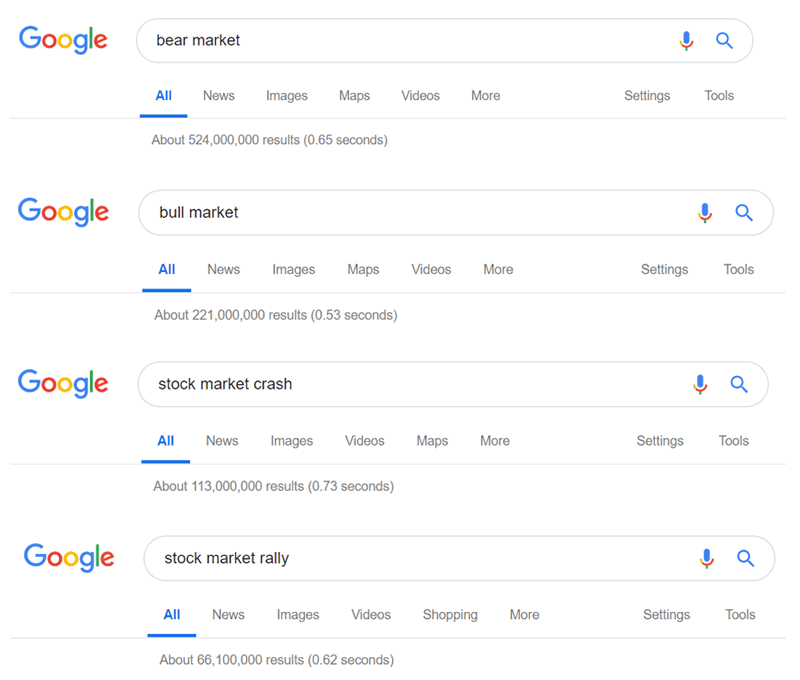
Type in “bear market” into Google. Then type in “bull market” into Google. Bearish articles are 2x as popular as bullish articles, even though the stock market goes up >50% of the time. So in other words, the media (including social media) leans bearish, whereas in reality the stock market goes up more often than it goes down. Bad news sells.
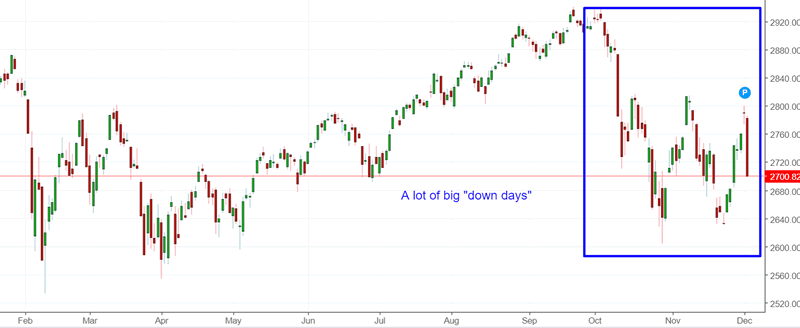
A lot of big “down days”
If it seems like the S&P has been crashing on a lot of days recently, it’s because it has. There have been 3 days in the past 2 months in which the S&P fell more than -3%.
This is rare, especially with the S&P so close to an all-time high. (Most big -3% days occur after the stock market has already crashed 30-40%).
Here’s what happened next to the S&P 500 when it falls more than -3% on 3 days in the past 2 months, while within 10% of a 2 year high.
*Data from 1929 – present
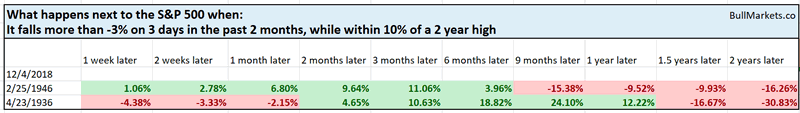
As you can see, the sample size is very small. n = 2
Let’s relax the parameters
Here’s what happened next to the S&P 500 when it falls more than -3% on at least 2 days in the past 2 months, while within 10% of a 2 year high.
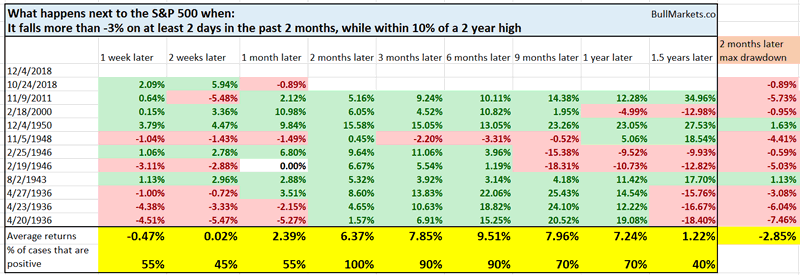
You can see a clear pattern. The stock market does well 2-6 months later, after which forward returns start to deteriorate (especially 1.5 years later).
Where’s the Santa Claus Rally?
The stock market fell more than -3% in 1 day. This is uncommon in December because a lot of investors and traders are looking for the “Santa Claus Rally”.
Here’s every single -3% decline in a December from 1927 – present, and what the stock market did next
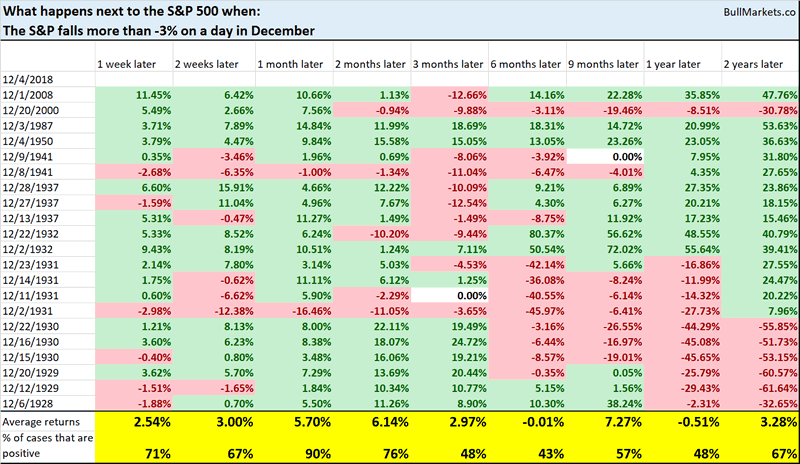
Remarkably, the stock market was up 90% of the time 1 month later. So perhaps the Santa Claus Rally will appear after all?
*I don’t pay that much attention to seasonality. Seasonality factors are of secondary importance.
VIX is subdued
VIX was quite interesting today. The S&P fell more than -3%, yet VIX went up less than 30%.
- This is common AFTER the stock market has already crashed 30-40%. As VIX gets higher and higher, its % movement gets smaller (there’s an upper ceiling on “fear”)
- This is uncommon when the stock market is still close to an all-time high. Usually when the stock market crashes -3% while so close to an all-time high, VIX can spike 30-50% in 1 day.
Here’s what happened next to the S&P 500 when the S&P fell more than -3%, VIX went up less than +30%, while the S&P was within 10% of a 1 year high.
*Data from 1991 – present
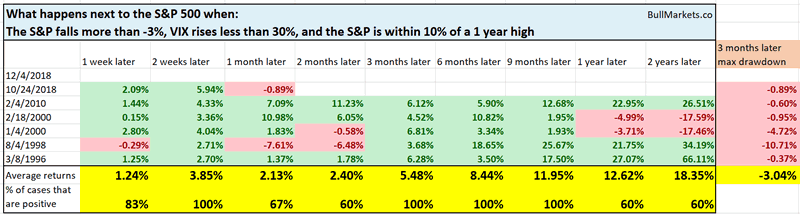
As you can see, the stock market does well 6-9 months later, after which forward returns deteriorate.
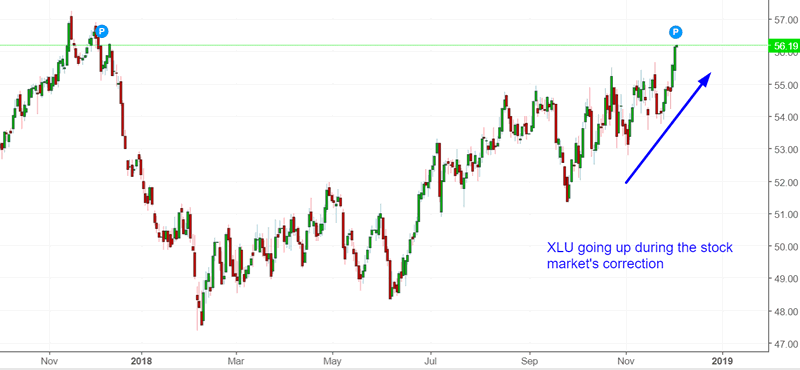
XLU
One of the things that worries me is XLU’s performance during this correction. XLU = utilities, a defensive sector.
XLU actually went up today while the stock market fell more than -3%. This is uncommon. It represents the market’s rotation to defensive sectors.
Here’s what happened next to the S&P 500 when XLU went up, while the S&P fell more than -3% that day.
*Data from 1998 – present
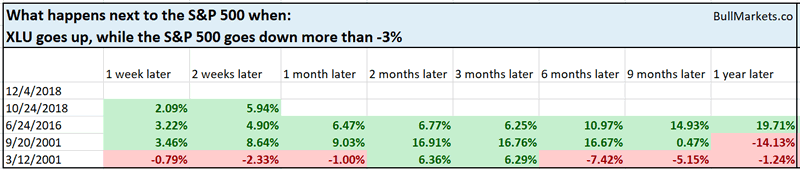
As you can see, the most bullish returns occur 2-3 months later, after which performance starts to deteriorate.
n = 3, so take this study with a grain of salt.
Why you want to ignore the short term
Now, more than ever, it is important to ignore the short term. This is something that Stan Druckenmiller mentioned in September: the market’s short term price action is changing thanks to algos. This results in a lot of whipsaw for short term traders, whereas medium term and long term traders can avoid this. (Algos impact the market’s short term, but have little impact on the medium term or long term simply because algos only hold their positions for short periods of time).
The stock market either doesn’t move (very low volatility), or it moves like crazy (high volatility) nowadays. There is no inbetween anymore. That’s what algos do. For more information, I suggest you read the Bloomberg article here.
Click here to see yesterday’s market study
Conclusion
Our discretionary technical outlook remains the same:
- The current bull market will peak sometime in Q2 2019. Then a bear market will ensue. We are in a long term topping process. Tops are a process marked by large UP and DOWN swings, not an event.
- The medium term remains bullish (i.e. approximately next half year).
- The short-medium term is mostly a 50-50 bet.
We focus on the medium term and long term. We mostly ignore the short term, which is usually just noise.
Our discretionary market outlook is not a reflection of how we’re trading the markets right now. We trade based on our clear, quantitative trading models, such as the Medium-Long Term Model.
Members can see exactly how we’re trading the U.S. stock market right now based on our trading models.
Click here for more market studies
By Troy Bombardia
I’m Troy Bombardia, the author behind BullMarkets.co. I used to run a hedge fund, but closed it due to a major health scare. I am now enjoying life and simply investing/trading my own account. I focus on long term performance and ignore short term performance.
Copyright 2018 © Troy Bombardia - All Rights Reserved
Disclaimer: The above is a matter of opinion provided for general information purposes only and is not intended as investment advice. Information and analysis above are derived from sources and utilising methods believed to be reliable, but we cannot accept responsibility for any losses you may incur as a result of this analysis. Individuals should consult with their personal financial advisors.
© 2005-2022 http://www.MarketOracle.co.uk - The Market Oracle is a FREE Daily Financial Markets Analysis & Forecasting online publication.