


Crude Oil After November’s Declines
Commodities / Crude Oil Dec 03, 2018 - 03:33 PM GMTBy: Nadia_Simmons

November was the worst month for oil bulls since July 2016. Over the past few weeks, the price of black gold has dived deeply, sometimes dropping even under the barrier of $50. What impact did this price action have on the long-, medium- and short-term picture of the commodity?
Let's start today’s alert with the long-term chart (charts courtesy of http://stockcharts.com).
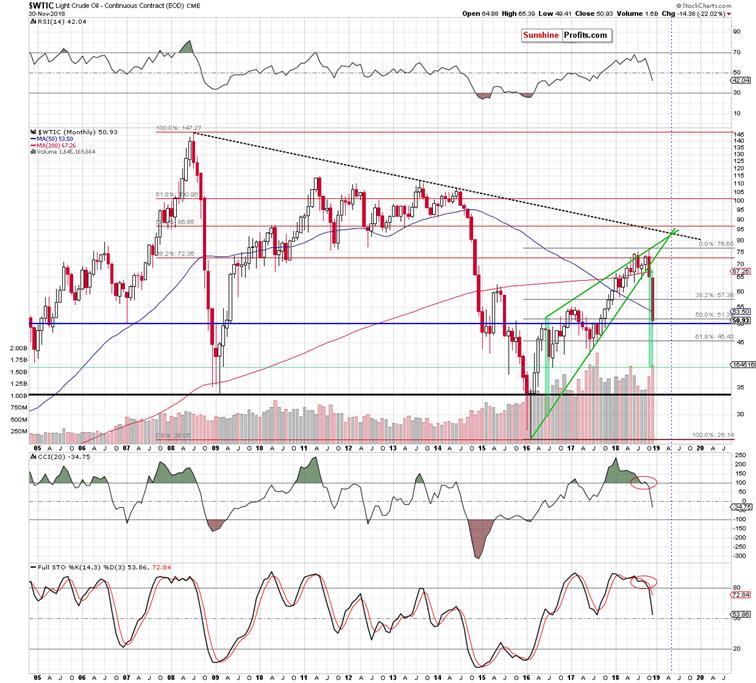
Looking at the above chat, we see that October’s breakdown under the lower border of the green wedge, encouraged oil bears to show their claws. Thanks to their attack, the price of light crude not only declined below the 38.2% or 50% Fibonacci retracements, but also under the 50-month moving average and the barrier of $50.
From today’s point of view, we see that oil bulls managed to trigger a rebound before the month’s closure, which saved them from the breakdown below the above-mentioned psychologically important level of $50.
Nevertheless, size of the last week’s volume was huge, which confirms the sellers’ strength and their involvement in the November’s correction. Additionally, the sell signals generated by the monthly indicators remain in the cards, suggesting that the worst might be still ahead of the buyers.
Are there any positive technical factors on the horizon that can save the bull's skins? Let’s take a closer look at the medium-term chart.
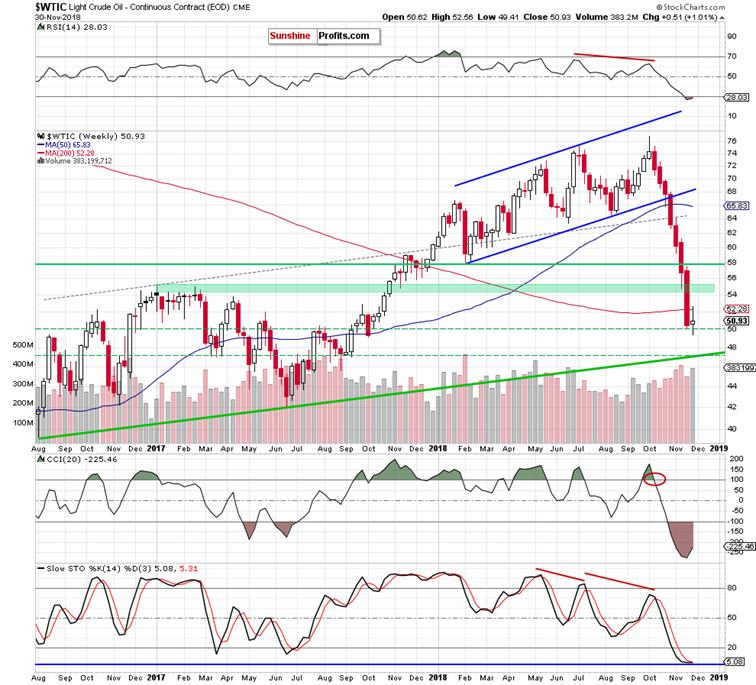
From this perspective, we see that although the buyers closed the previous week above the barrier of $50, the price of the commodity is still trading under the previously-broken 200-week moving average, which doesn’t look encouraging from the bulls’ point of view.
Why? We think that the best answer to this question will be the quote from our Tuesday’s alert:
(…) Such price action suggests that we could see nothing more than a verification of the earlier breakdown under this support. If this is the case, the price of light crude will likely move lower once again and test the recent lows, the barrier of $50 or even the support area created by the 76.4% and the 78.6% Fibonacci retracements (marked on the daily chart (…) with the green horizontal dashed lines) in the following days.
On the other hand, the last week’s rebound materialized on higher volume than the earlier decline, which suggests that higher prices might be just around the corner (IF oil bulls show strength in the coming week). This scenario is also reinforced by the current position of the medium-term indicators, which are extremely oversold and close to generating the buy signals.
Nevertheless, in our opinion, as long as there are no signs of the bulls’ strength opening long positions is justified from the risk/reward perspective.
When can we expect a more reliable improvement? In our opinion, such price action will be more likely IF black gold successfully invalidates the earlier breakdown under the above-mentioned 200-week moving average and the 50% Fibonacci retracement marked on the long-term chart.
Having said the above, let’s analyze the short- and the very short-term changes.
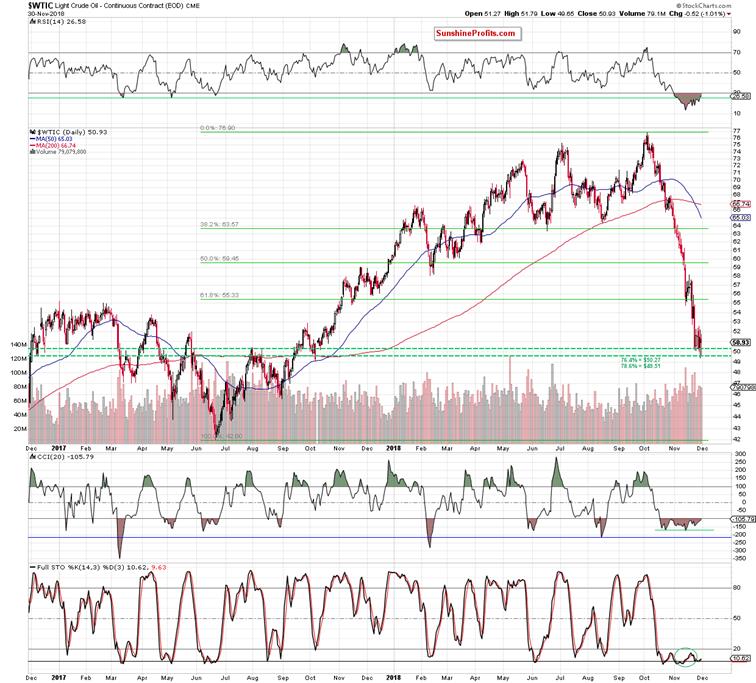
Looking at the daily chart from a bit broader perspective, we see that light crude closed the week above the support area created by the 76.4% and the 78.6% Fibonacci retracements (marked on with the green horizontal dashed lines), which is a positive sign. However, despite this price action there are still no buy signals that could encourage buyers to operate more effectively.
Let’s zoom in our picture to see the recent price action more clearly.
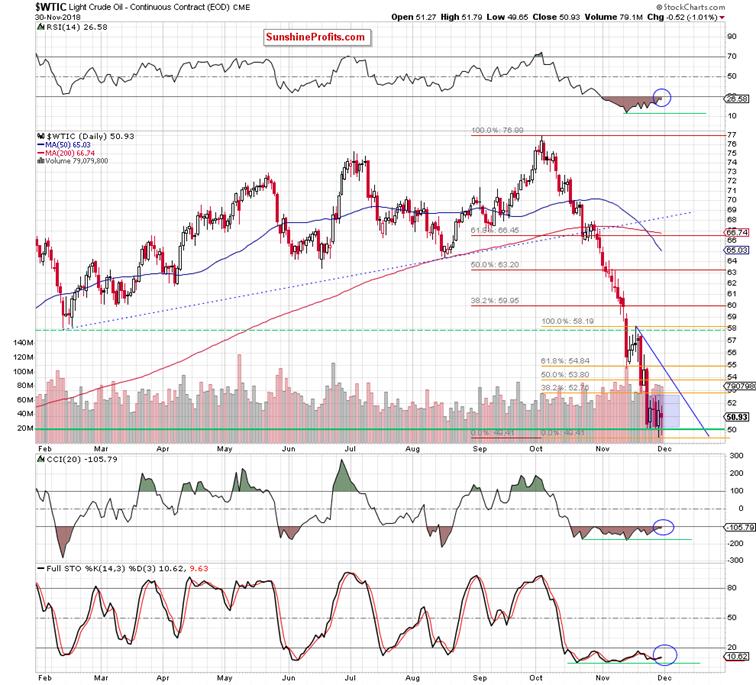
As you see on the above chart, the overall situation in the very short term remains almost unchanged as crude oil is still trading in a narrow range (the blue consolidation) between the barrier of $50 and the 38.2% Fibonacci retracement based on the recent wave of the downward move (marked with orange).
Taking this fact into account, we believe that as long as there is no breakout above the upper border of the formation and the above-mentioned retracement (and also above the 200-week moving average, which intersects and reinforces this resistance area) higher prices of black gold are not likely to be seen – especially if we do not even see buy signals generated by the daily indicators.
Finishing today’s alert, it’s worth noting that crude oil futures opened Monday’s trading with the gap, which suggests that further improvement might be just around the corner. However, please not that if the buyers fail once again and do not manage to break above the first resistance area, another test of the barrier of $50 and the above-mentioned supports can’t be ruled out.
If you enjoyed the above analysis and would like to receive free follow-ups, we encourage you to sign up for our daily newsletter – it’s free and if you don’t like it, you can unsubscribe with just 2 clicks. If you sign up today, you’ll also get 7 days of free access to our premium daily Oil Trading Alerts as well as Gold & Silver Trading Alerts. Sign up now.
Nadia Simmons
Forex & Oil Trading Strategist
Przemyslaw Radomski
Founder, Editor-in-chief
Sunshine Profits: Gold & Silver, Forex, Bitcoin, Crude Oil & Stocks
Stay updated: sign up for our free mailing list today
* * * * *
Disclaimer
All essays, research and information found above represent analyses and opinions of Nadia Simmons and Sunshine Profits' associates only. As such, it may prove wrong and be a subject to change without notice. Opinions and analyses were based on data available to authors of respective essays at the time of writing. Although the information provided above is based on careful research and sources that are believed to be accurate, Nadia Simmons and his associates do not guarantee the accuracy or thoroughness of the data or information reported. The opinions published above are neither an offer nor a recommendation to purchase or sell any securities. Nadia Simmons is not a Registered Securities Advisor. By reading Nadia Simmons’ reports you fully agree that he will not be held responsible or liable for any decisions you make regarding any information provided in these reports. Investing, trading and speculation in any financial markets may involve high risk of loss. Nadia Simmons, Sunshine Profits' employees and affiliates as well as members of their families may have a short or long position in any securities, including those mentioned in any of the reports or essays, and may make additional purchases and/or sales of those securities without notice.
© 2005-2022 http://www.MarketOracle.co.uk - The Market Oracle is a FREE Daily Financial Markets Analysis & Forecasting online publication.