What the Oil Short-sellers and OPEC Don’t Know about Peak Shale
Commodities / Crude Oil Nov 30, 2018 - 04:47 PM GMTBy: Andrew_Butter
 A Black Swan is when something dramatic happens that most people did not expect, like when house prices went down, not up...remember that?
Last week on Bloomberg News, Javier Blas wrote of a new “Shale Boom” that could...create “OPEC’s Worst Nightmare”. https://www.bloomberg.com/news/articles/2018-11-21/opec-s-worst-nightmare-the-permian-is-about-to-pump-a-lot-more
That sentiment reflects a broad consensus of opinion that has driven oil prices down 30% in two months. The central theme of the article was that the spike in year-on-year change of U.S. production of “oil, condensate, and natural gas liquids”, to 3.0 million barrels per day (MBPD) in August 2018, was proof of shale-oil’s continuing resurgence.
And the price of bananas is up this month too. That’s obviously proof; the year-on-year change in U.S. shale oil production was 1.78 MBPD in August 2018, this month its 1.32 MBPD. That’s down (20%), not up.
A large part of the rest of that was non-shale crude oil; 400,000 BPD new offshore-production coming on-line from, zero the month before. That extra-production was sanctioned before the 2014 bust; which illustrates how long it can take from the final decision for a non-shale-oil venture, until the oil starts to flow. In any case, one spike is not a trend; last month that was down to 300,000 BPD.
This is the chart put up by Javier Blas, with shale-oil superimposed:
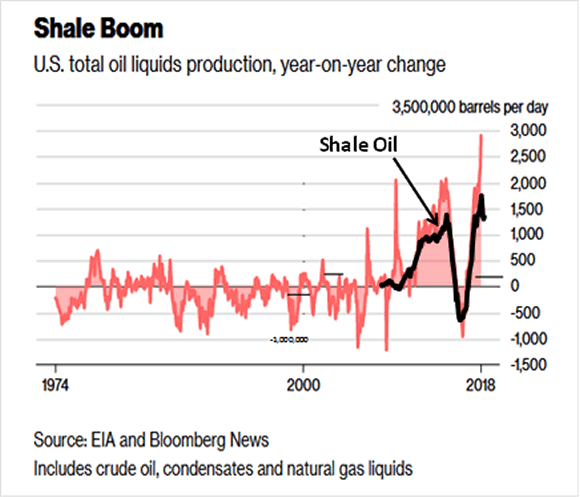
However you look at it, change in shale-oil production has been trending down for the past six months. That’s not a sign of a boom set to explode, rather the opposite.
Perhaps the confusion was because the Energy Information Administration (EIA), which reports all those numbers, issues multiple, and in some cases, overlapping-reports, so now-and then commentators can confuse apples with banana’s, or condensate with crude. Also EIA doesn’t add-up all the numbers; so to make useful comparisons, sometimes it’s necessary to do a little simple arithmetic.
This is a chart of the more recent history:
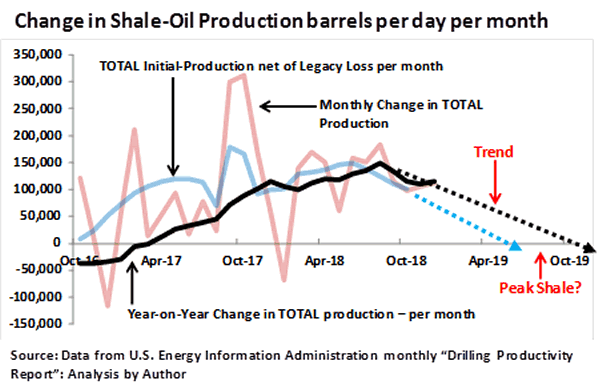
The black line is the one line in the preceding chart, divided by 12-months for comparison with other monthly estimates. The blue line is total initial production (IP), calculated by multiplying IP-per-rig in each region by numbers of rigs, adding that up and then subtracting total legacy loss. That’s a measure of the capacity, and the enthusiasm of operators to drill.
OK; the down-trend could be a blip, eyeballing trends is a mug’s game; but right now the trend is not up, it’s down; in other words the conclusion of “Shale-Boom round the corner”, might have been incorrect? Perhaps that tag-line should be re-worded to say “Black Swan on the Horizon”?
“Black-Swan” because if shale doesn’t deliver what almost everyone is projecting, and conventional E&P, which is still in the doldrums, cannot deliver enough to plug that gap, which is what the CEO of Schlumberger and the Director of IEA, recently warned might happen, the price of oil could spike.
Granted, there are plausible reasons for why the trend in growth-rate of shale-oil production has been going down, not up, some of which are presented by Javier Blas. His overriding thesis is that now, the pipelines serving Permian, are maxed-out, new pipelines are being built, once those come on line, there will be a boom.
That makes some sort of sense, but there are other ways to transport oil out of Permian, the reason operators prefer pipelines is because they are cheaper. Year-on-year, up to last month, oil prices went up by 45%, that ought to have covered the increased cost of shipping, if that was really what was holding shale back.
Blas also reports that he was told by “informed sources”; that in Permian, operators are drilling wells but not completing them, waiting for a good moment to do that, as in when either the oil-price goes up, or the pipelines come on-stream.
That’s another credible story; day-rates of drilling rigs, are going-up fast; so that could make sense, locking in low-cost before they go up more. But there-again, Blas’s sources...oil-men; are known to be economical with the truth, from time to time; and they are perennial optimists; bless-them.
Drilled but Uncompleted (DUC) wells in Permian went from just 1,000 in 2014 to 4,000; over the past two years; on average, 35% of drilled wells in Permian ended up as DUC’s, so clearly there could be some truth in that story.
But some snide-commentators have suggested that many DUC’s are in fact, Dead-On-Arrival’s (DOA’s). You only get to know for sure what is the geology of the hole you drilled, after you drilled it, so a common reason to decide not to pump the sand and buy the pads; which are the expensive parts of the operation; might be that what you got was less than optimal.
This chart can perhaps explain what’s going on:
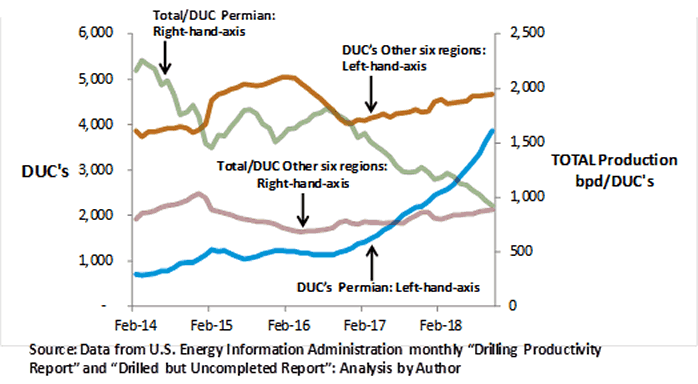
Yes DUC’s in Permian shot up, but that’s not a recent development, it started long-before there was talk of pipelines maxing-out. In early 2016, DUC’s in other regions fell, that was completions catching up, but only about 20% of the “inventory” was completed, and Initial Production per completion (shown below), fell by 40%, indicating that those DUC’s were less than optimal. Perhaps the remaining 80% were DOA’s?
In 2014 there were 4,000 holes in the ground in the six non-Permian regions, out of those, over the past four years likely none have been completed. Sure a DUC looks great on the balance-sheet, “oil in the bank.”; if you got your auditor in your pocket. Oil-men hate to write-off stuff, I know a guy who bought twenty air-operated winches for $200,000 in 1998, great buy, never been rented, he thinks they are worth $500,000, perhaps in twenty years, as museum items; perhaps they may exhibit those 4,000 DUC’s as part of the show. No doubt, in twenty-year’s time, there will be a huge demand to see the 4,000 holes drilled in West Texas. Meanwhile, hardly anyone made any money in U.S. shale, leaving aside the bravado, there are signs that “there’s a hole in daddy’s arm, where all the money goes”
https://www.youtube.com/watch?v=xSeBEgFjGLA
In 2014 Permian production accounted for 35% of total U.S. Shale production, now it’s 47%. Perhaps the increased production was thanks to dirt-cheap day rates on drilling rigs, meaning that it was acceptable to risk more DOA’s?
Total production per DUC has fallen dramatically in Permian, down to the level found in the other regions, perhaps all that’s happening is a normalization, and that when the “rainy-day” comes, less than 20% of Permian DUC’s will get completed?
Another indicator worth keeping an eye on; is initial production per completion; the main reason no one tracks those numbers is EIA don’t report them, so you need to do arithmetic to work them out.
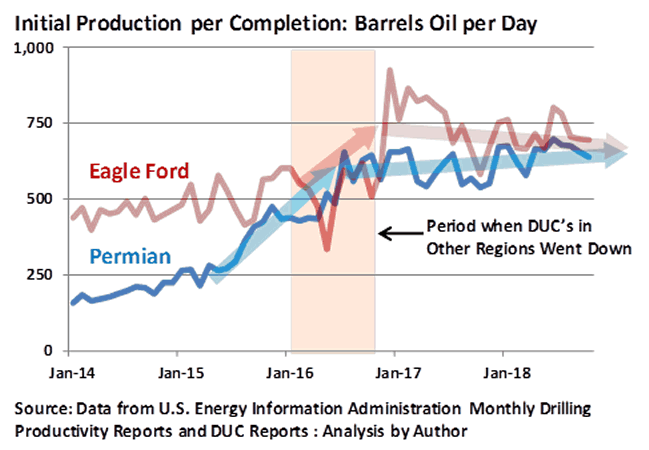
Another story that has been making the rounds is the one about how the resurgence of shale-oil was thanks to can-do ingenuity and technology. The evidence does not support that thesis, although that’s not common knowledge because to see that number you need to work out IP from the DPR, then you need to get the other report EIA puts out, confusingly called the “Drilled but Uncompleted Report”, which enigmatically contains information on completions, which is not something you might not have guessed, from the title. No wonder everyone is confused about what’s going up and what’s going down.
Yes indeed, IP/C went up dramatically in Permian after oil prices tanked, until two years ago. That marker went down in Eagle ford, during the time 20% of the “rainy-day” DUC’s were completed, then when they got back into gear, drilling and completing, that spiked, but the trend now, is down, not up.
Perhaps, in fact, the “magic” was nothing to do with technology, after all hydraulic-fracturing has been around for years, long before anyone thought of using it for shale? In 2016 hardly-used drilling rigs; and power-packs to pump the sand could be bought from liquidators for pennies; the cost of sand went from $87/ton to $25; and guess what, there is a straight-line correlation between how much sand you pump, and initial production (within limits). So everyone started drilling longer laterals, so they could pump more cheap sand.
But today sand costs $75/ton; CAT jacked prices on the power-packs, steel for the casing and the pads costs double what it was in 2016, oil-service companies are starting to pick up business offshore, so their prices went up, and the best drillers and geologists are trading views of Permian farm-land, for all-round sea-views and layovers in Phuket.
Here’s a thought, perhaps the reason why, since the re-boot in September 2016, shale oil production went up by 2.4 MBPD, which is much more than OPEC took off the table, was simply that costs went down. If so, now that costs have gone up, and are set to go up more, logically that should mean new-production is set to go...down, not up?
This is a plot of total initial production, net-legacy; against the six-month trailing oil price.
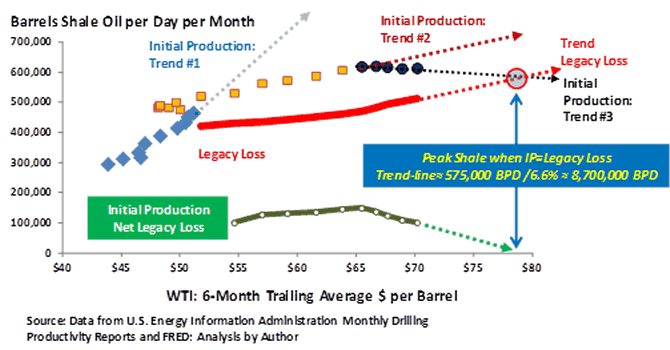
The X-axis is the six-month trailing average of WTI, which is kind-of a proxy for time, these-days. The idea for using that is because shale-drillers look at where the price seems to be going, decide how much to hedge, then go for it. Shale is many short-term plays, if you don’t make your money-back on a play in eighteen months, well; you need to put on your best suit, polish your cowboy boots, and go find another sucker on Wall Street.
Trend #1: Low oil price, OPEC thought they had shale on the run, if they kept pumping shale would die. Except E&P worldwide ground to a halt, costs went towards zero, and pesky shale came back, with a vengeance.
Trend #2: Yes oil prices were up, but costs went up faster.
Trend #3: That’s logical...to a Black Swan; oil prices going up and shale Initial Production goes down.
Last but not least, is the trend in legacy-loss, right now shale needs to find 500,000 bpd new oil every month, just to stay-even; that number is going up; when it equals IP, that’s Peak Shale.
Intriguingly, when OPEC cut back, oil prices went up, and that hastened the demise of shale, because costs went up more than prices. That’s a negative feedback loop, (1) oil price goes up; (2) everyone starts to drill, (3) cost of drilling goes up so no-one makes any money; (4) everyone stops drilling, (5) price of oil goes up...round and round.
The reason oil prices crashed to under $30 Brent, not $64, which is where anyone who predicted the bust, more than two years in advance, said it would go; was because for two years OPEC, uncharacteristically, decided to pump more, not less.
They deny that was a strategy to kill-off shale oil. In any case if that was the strategy it didn’t work, because the whole of the oil industry all over the world imploded; so anyone with any sense could buy bank-owned equipment for pennies.
Then, because costs were through the floor, shale boomed. Thank you very much Mr. OPEC.
The best-thing OPEC can do next week; would be to cut production, and then wait, for a year or so, for shale oil to wither and die. Whether or not that will leave enough time for conventional E&P to plug the gap, is anyone’s guess.
The model that, in 2011, predicted the oil price would plunge to $64, is saying it won’t, and likely within a few years we could be looking at $150 Brent. That’s up, not down.
By Andrew Butter
Twenty years doing market analysis and valuations for investors in the Middle East, USA, and Europe. Ex-Toxic-Asset assembly-line worker; lives in Dubai.
© 2018 Copyright Andrew Butter- All Rights Reserved
Disclaimer: The above is a matter of opinion provided for general information purposes only and is not intended as investment advice. Information and analysis above are derived from sources and utilising methods believed to be reliable, but we cannot accept responsibility for any losses you may incur as a result of this analysis. Individuals should consult with their personal financial advisors.
Andrew Butter Archive |
© 2005-2022 http://www.MarketOracle.co.uk - The Market Oracle is a FREE Daily Financial Markets Analysis & Forecasting online publication.


