


Will Oil Price Crash Lead to “Contagion” for the U.S. Stock Market?
Stock-Markets / Stock Markets 2018 Nov 15, 2018 - 05:26 PM GMTBy: Troy_Bombardia

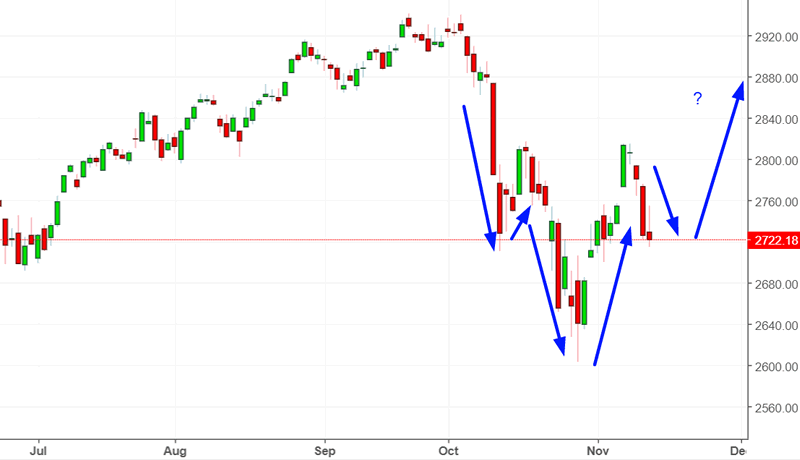
 Oil’s crash is historic – this is the most oversold oil has been from 1983 – present. Will oil’s crash lead to “contagion” for the U.S. stock market? Meanwhile, some traders think that the S&P 500 is making an “inverted head and shoulders” bottoming pattern.
*We usually ignore such chart patterns. These patterns work perfectly with 20/20 hindsight, but are no better than a coin toss in real-time.
Let’s determine the stock market’s most probable direction by objectively quantifying technical analysis. For reference, here’s the random probability of the U.S. stock market going up on any given day, week, or month.

*Probability ≠ certainty.
Oil’s capitulation selling?
A quick glance at oil’s chart reveals how intense oil’s crash really is.
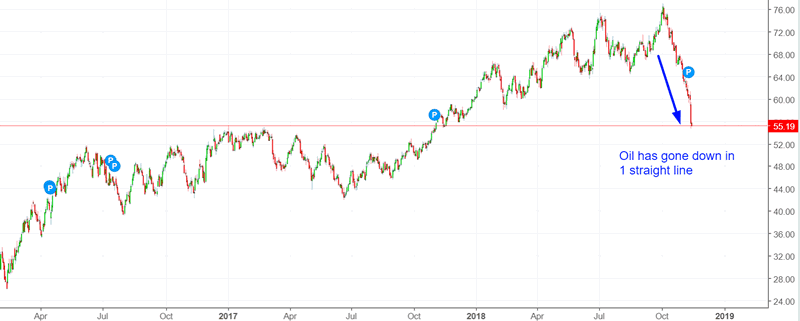
Oil crashed more than -7% on Tuesday. Is this a sign of “capitulation selling”? Is oil’s bottom in?
Here’s what happened next to oil when it crashed more than -6% to a 1 year low.
*Data from 1983 – present
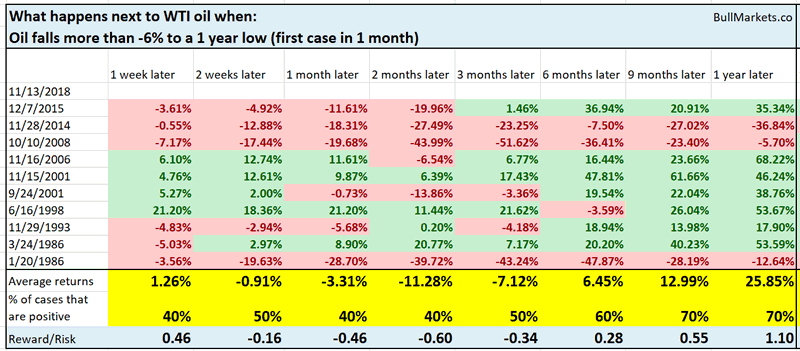
As you can see, oil’s returns over the next 3 months lean bearish.
But is this a bearish sign for the U.S. stock market? Will this lead to “contagion” for U.S. stocks?
Here’s what happened next to the S&P 500 when oil crashed more than -6% to a 1 year low.
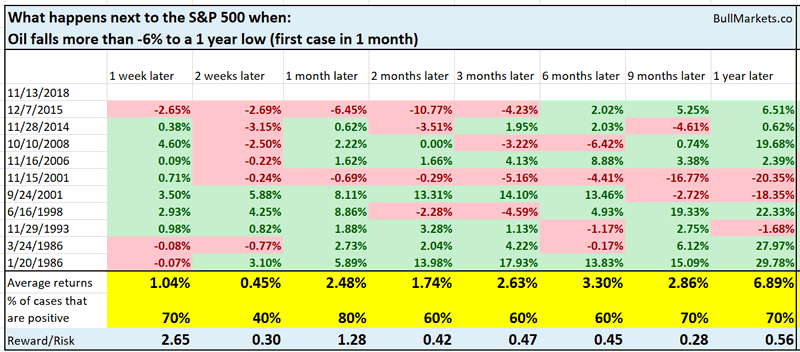
As you can see, the stock market’s forward returns aren’t consistently bullish nor bearish. Oil’s crash is mostly an irrelevant factor for the stock market.
Russell will make a “death cross”
The Russell 2000’s 50 day moving average will fall below its 200 day moving average tomorrow. This is called a “death cross”.
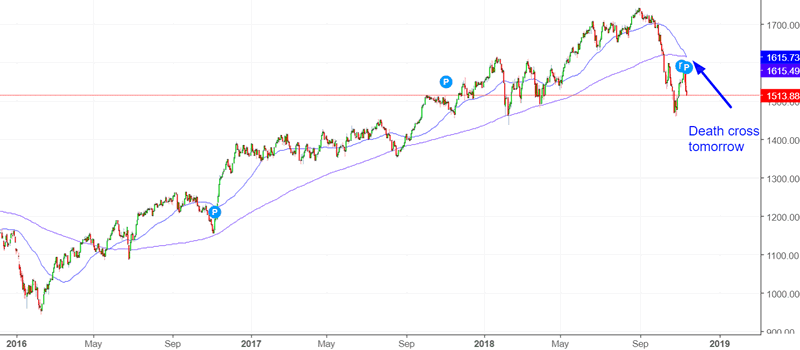
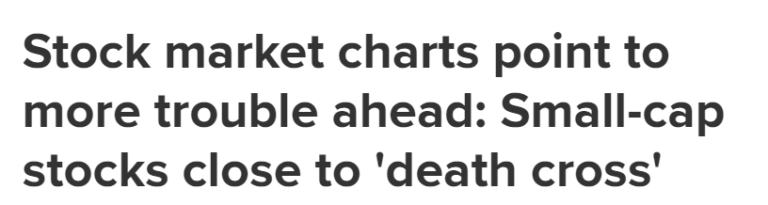
And right on cue, financial media picks this up as BEARISH! From CNBC:
Is this bearish for the stock market?
Here’s what the Russell 2000 did next when it made a “death cross”.
*Data from 1980 – present
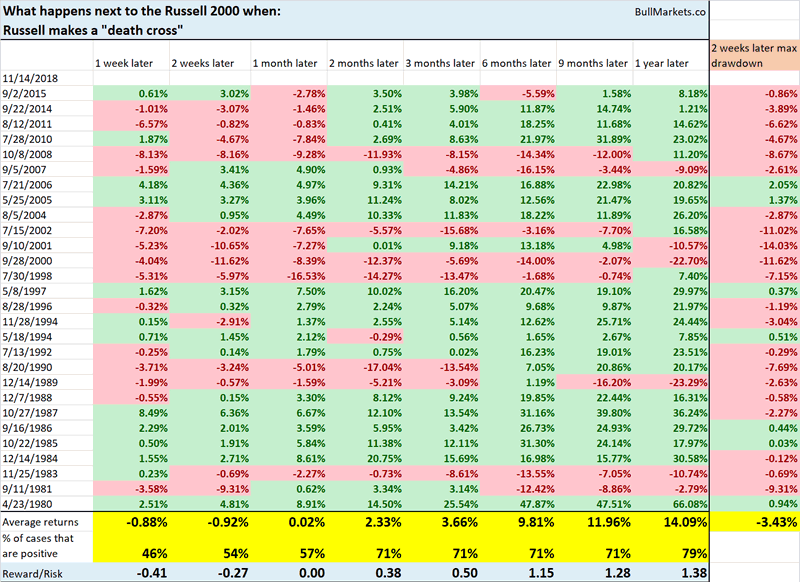
As you can see, small caps can face short term weakness over the next 1-2 weeks, after which forward returns are neither consistently bullish nor bearish.
This is a short term bearish sign for the stock market, but it doesn’t mean anything for the medium-long term.
Rising Put/Call ratio
The Total Put/Call Ratio (a sentiment indicator) has been trending upwards. Its 50 day moving average is now above 1.033, which is high (historically speaking)
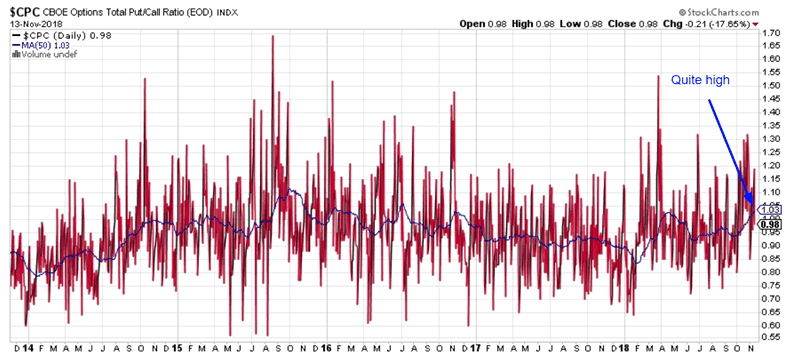
Here’s what happened next to the S&P when the Put/Call ratio’s 50 day moving average rose above 1.033 (first time in 1 month).
*Data from 1995 – present
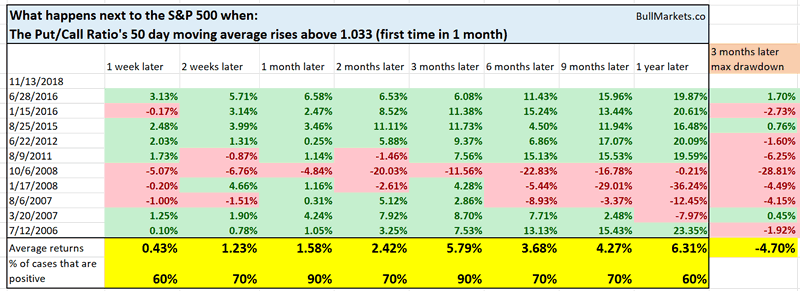
As you can see, stocks tend to do well over the next 3 months. The sole bearish case was October 6, 2008, when the stock market had already crashed 30%+ and the economy was deep in a recession. Different context.
NYMO
NYMO is the NYSE McClellan Oscillator (a breadth indicator). Going into the S&P 500’s bounce from last week, NYMO became very high. When this happens, the stock market tends to fall in the short term, and then make a medium term bounce.
NYMO has now fallen, along with the stock market. It has gone from above 70 to less than 10.
Here’s what happened next to the S&P 500 when NYMO rises above 70 and falls below 10 in less than 2 weeks.
*Data from 1998 – present
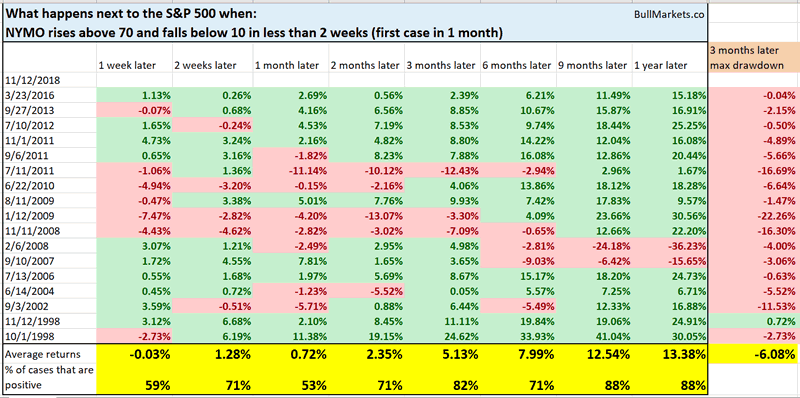
As you can see, the stock market tends to swing sideways in a volatile manner over the next 1 month (up and down), but it tends to go up 3 months later.
Click here to see yesterday’s market study
Conclusion
Our discretionary technical outlook remains the same:
- The current bull market will peak sometime in Q2 2019.
- The medium term remains bullish (i.e. trend for the next 6-9 months).
- The short-medium term leans bearish. There’s a >50% chance that the S&P will fall in the next few weeks.
Focus on the medium term and long term. The short term is usually just noise.
Our discretionary outlook is usually, but not always, a reflection of how we’re trading the markets right now. We trade based on our clear, quantitative trading models, such as the Medium-Long Term Model.
Members can see exactly how we’re trading the U.S. stock market right now based on our trading models.
Click here for more market studies
By Troy Bombardia
I’m Troy Bombardia, the author behind BullMarkets.co. I used to run a hedge fund, but closed it due to a major health scare. I am now enjoying life and simply investing/trading my own account. I focus on long term performance and ignore short term performance.
Copyright 2018 © Troy Bombardia - All Rights Reserved
Disclaimer: The above is a matter of opinion provided for general information purposes only and is not intended as investment advice. Information and analysis above are derived from sources and utilising methods believed to be reliable, but we cannot accept responsibility for any losses you may incur as a result of this analysis. Individuals should consult with their personal financial advisors.
© 2005-2022 http://www.MarketOracle.co.uk - The Market Oracle is a FREE Daily Financial Markets Analysis & Forecasting online publication.