


Why the End of the Longest Crude Oil Bull Market Since 2008?
Commodities / Crude Oil Nov 13, 2018 - 03:11 PM GMTBy: Dan_Steinbock

 In the past two years, crude oil has steadily advanced, supported by global recovery. But in just 10 days, oil has posted the longest losing streak since mid-1984 – thanks to overcapacity and the Trump trade wars.
Half a year ago, crude oil prices were expected to climb from $53 per barrel in 2017 to $65 per barrel by the year-end and to remain around that level through 2019. By mid-October, crude had soared to $75 and the rise was expected to continue.
Yet, in just 10 days oil has fallen to less than $60. Oil prices are in a bear market one month after four-year highs. The question is: Why?
Oil’s short-term fluctuations
The simple answer is that until mid-October the escalation of US-Sino trade tensions, despite President Trump’s vocal rhetoric, seemed to be manageable, which supported global prospects. Yet, the US mid-term elections have contributed to growing volatility and uncertainty.
Trump’s illicit decision to withdraw from the Iran nuclear deal (JCPOA) contributed to the upward oil trajectory, along with the expected supply disruptions in Venezuela which is amid domestic economic turmoil and US efforts at regime change.
As US-China tensions continue to linger and bilateral talks have not resulted in tangible results, expectations have diminished regarding the anticipated Trump-Xi meeting in late November. Consequently, global recovery no longer seems as solid as analysts presumed only recently. Even signs that OPEC and other oil producers including Russia could soon cut output have not put a floor under the market.
Also, Trump’s concession, after heavy pressure by Brussels, to allow Iran to remain connected to SWIFT, which intermediates the bulk of the world’s cross-border dollar-denominated transactions, has contributed to more subdued oil price trajectory.
Another supply-side force involves US crude inventories that have been swelling. These stockpiles rose by 5.7 million barrels toward the end of October, although gasoline and distillate supplies shrunk, according to American Petroleum Institute. US production is reportedly rising faster than previously projected.
But whether these near-term forces will prevail depends on longer-term structural conditions.
Global crisis and post-crisis fluctuations
At the eve of the global financial crisis in summer 2008, crude oil reached an all-time high of $145.31. As the bubbles burst, crude plunged to a low of $40; a level it first reached at the turn of the ‘80s, amid Iran’s Islamic Revolution.
During the global crisis in 2008-9, the US Fed and other central banks in the major advanced economies cut the interest rates to zero, while resorting to rounds of quantitative easing. Meanwhile, policymakers in advanced economies deployed fiscal stimulus packages to re-energize their economies. So, crude rose again until the mid-2010s, when the price still hovered above $100 per barrel.
That trajectory came to an abrupt end, when the Fed initiated the rate hikes and normalization policies, which strengthen the US dollar, whereas oil prices, which remain denominated in dollars, took a dramatic plunge. By early 2016, crude prices fell to less than $30 – below the crisis low only eight years before.
Crude prices were also hit by the “oil glut”, or surplus crude oil around 2014-15, thanks to critical volumes by the US and Canadian shale oil production, geopolitical rivalries among oil-producing nations, the eclipse of the “commodity super-cycle,” and perceived policy efforts away from fossil fuels. As meetings by the Organization of the Petroleum Exporting Countries (OPEC) failed to lower the ceiling of oil production, the result was a steep oil price meltdown.
Eventually, the 13-member oil cartel was able to agree on a ceiling. At the eve of the OPEC talks in Vienna in spring 2017, oil prices rose to $55. Riyadh needed stability to cope with domestic economic challenges and the war against Yemen. So it permitted Iran to freeze output at pre-sanctions levels. Russia supported the cuts because it remains dependent on oil revenues. The extension also benefited shale and gas producers in the US and the Americas.
Crude prices began to climb, but thanks to the OPEC agreement to cut production.
Oil’s longer-term structural prospects
Crude markets are under secular transformation. Bargaining power has shifted from advanced economies to emerging nations. US is producing record levels of shale. Renewables are capturing more space. Due to sluggish demand, further cuts loom in horizon as prices remain subdued.
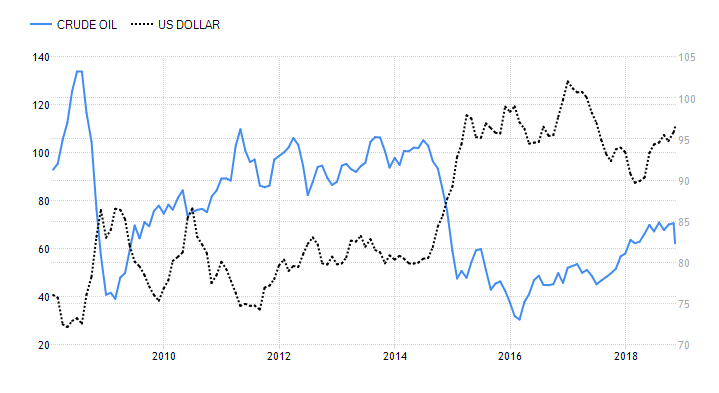
Moreover, when dollar goes up, oil tends to come down. Oil is denominated in US dollars, whose strength is intertwined with the Fed’s policy rate. As long as the Fed will continue to hike rates, this will contribute to further turbulence, particularly in emerging economies amid energy-intensive economic development (Figure).
Figure How US Dollar Undermined Crude Gains, 2008-2018
In November 2017, OPEC agreed to extend oil supply cuts until the end of 2018. That fueled crude from low-$50s in spring 2017 to more than $70 last mid-October. In effect, crude mirrored the elusive global recovery, along with the prime indicators of global economic integration.
It was these positive horizons of world trade, investment and finance that contributed to steady gains of crude prices until mid-October – but then the fragile recovery crumbled.
When President Trump showed no inclination toward US-Sino reconciliation, hopes associated with world trade, investment and finance finally dissipated. And as the prospects of global recovery turned elusive, crude prices began a steady fall.
In the short-term, the status quo could change, but that would require effective reconciliation in US-Sino friction and the reversal of US sanctions and energy policies, among other things. In the long-term, significant changes would require sustained OPEC production ceilings, economic malaise in leading emerging economies, dramatic reversal in world trade, investment and finance and – most importantly – the end of the dollar-denominated oil regime and thus the eclipse of US-Saudi military-energy alignment.
Some of these changes are not economically viable. Some are desperately needed internationally. Still others are not likely to materialize without significant conflicts and geopolitical realignments.
Ironically, there was nothing inevitable about the dramatic reversal of oil prices in October. It was not based on economics. Rather, it was the effect of overcapacity and the Trump trade wars fueled by hollow dreams of an ‘America First’ 21st century.
That’s America’s policy mistake, but global economy will pay the bill.
Dr Steinbock is the founder of the Difference Group and has served as the research director at the India, China, and America Institute (USA) and a visiting fellow at the Shanghai Institutes for International Studies (China) and the EU Center (Singapore). For more information, see http://www.differencegroup.net/
© 2018 Copyright Dan Steinbock - All Rights Reserved
Disclaimer: The above is a matter of opinion provided for general information purposes only and is not intended as investment advice. Information and analysis above are derived from sources and utilising methods believed to be reliable, but we cannot accept responsibility for any losses you may incur as a result of this analysis. Individuals should consult with their personal financial advisors.
Dan Steinbock Archive |
© 2005-2022 http://www.MarketOracle.co.uk - The Market Oracle is a FREE Daily Financial Markets Analysis & Forecasting online publication.