


The Stock Market’s Road Higher is Going to be Really Choppy
Stock-Markets / Stock Markets 2018 Nov 02, 2018 - 05:08 PM GMTBy: Troy_Bombardia

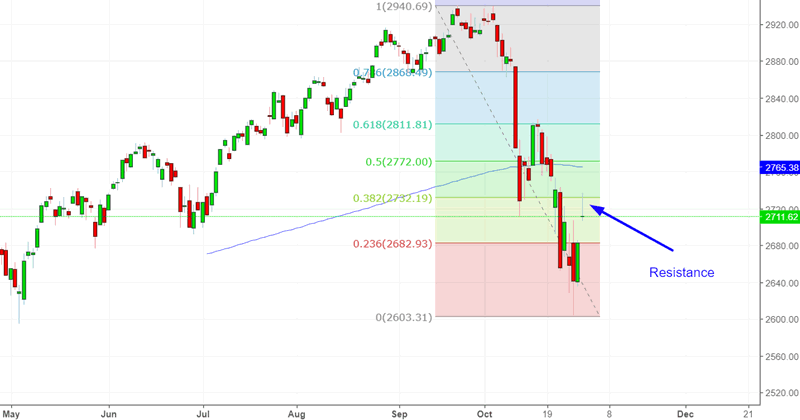
The U.S. stock market rallied today but faced resistance at its 38.2% retracement (38.2% retracement is the minimum requirement for a bounce).
Let’s analyze the stock market’s price action by objectively quantifying technical analysis. For the sake of reference, here’s the random probability of the U.S. stock market going up on any given day, week, or month.

*Probability ≠ certainty. But if you consistently trade against probability, then you will underperform in the long run.
A very big gap up
The S&P 500 made a very big gap up today. Today’s LOW was more than 0.7% above yesterday’s HIGH.
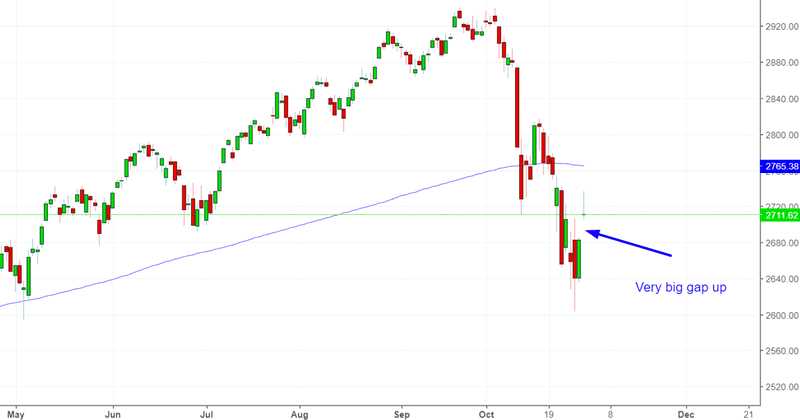
Such big “gap ups” are rare. (Conventional trading wisdom states that gap ups tend to be filled).
Here’s what happened next to the S&P 500 (historically) when the daily LOW was more than 0.7% above the previous day’s HIGH.
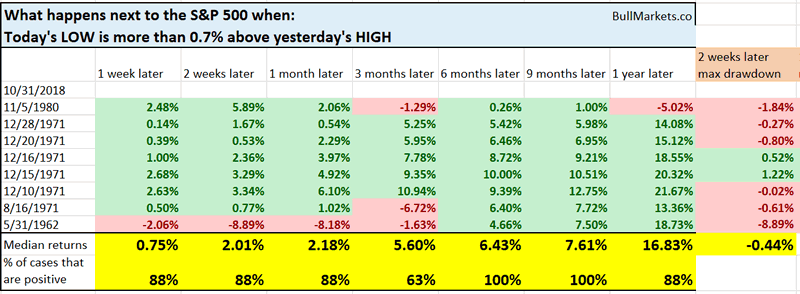
As you can see, the stock market tends to go up, especially 6-9 months later. Now granted, these historical cases cluster around 3 areas:
- 1980
- 1971
- 1962
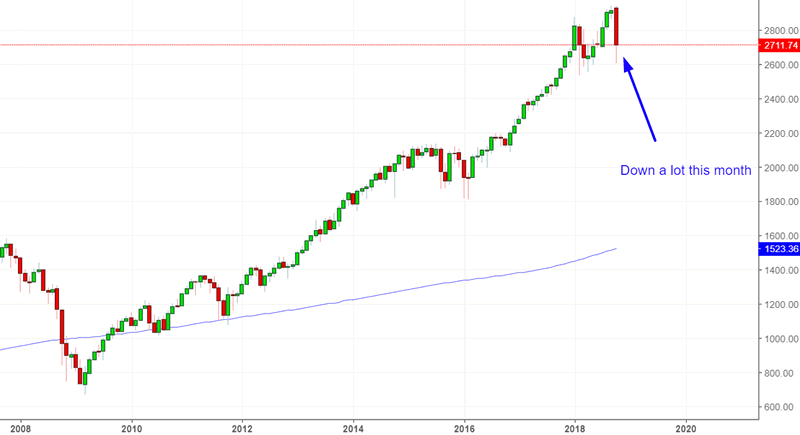
Terrible month
The S&P 500 fell more than -6% this month (using monthly CLOSE $’s). Such big losses are rare after an all-time high (using monthly CLOSE $’s).
*Data from 1950 – present
In fact, from 1950 – present, this has only happened 2 other times. In both cases the stock market went up.
*Data from 1950 – present
We can relax the study’s parameters to get more historical cases.
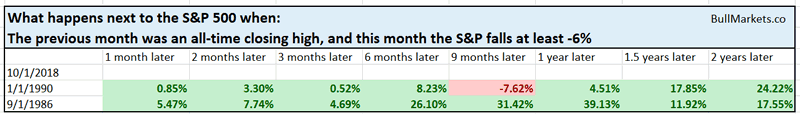
Here’s what happens next to the S&P 500 when it closed at a monthly all-time-high and then fell more than -5% the next month.
*Data from 1950 – present
As you can see, the S&P tends to go up.
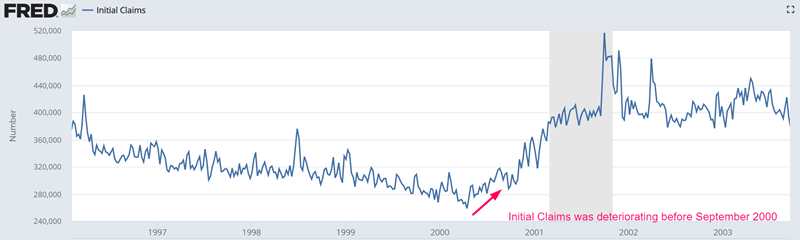
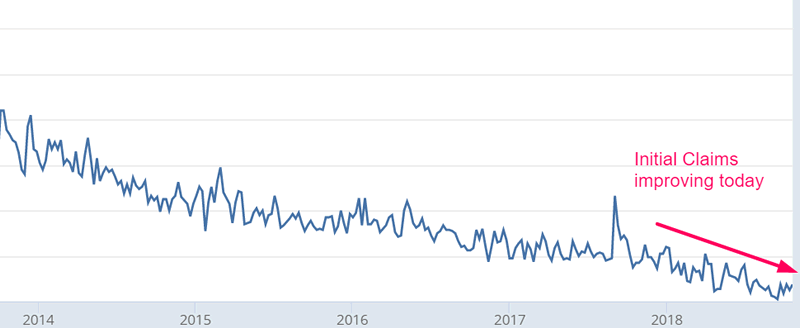
The one big exception was September 2000. But the context back then was different. In September 2000, the economy was already clearly deteriorating. Today, the economy is still improving, as seen through Initial Claims.
Will the U.S. stock market retest its lows?
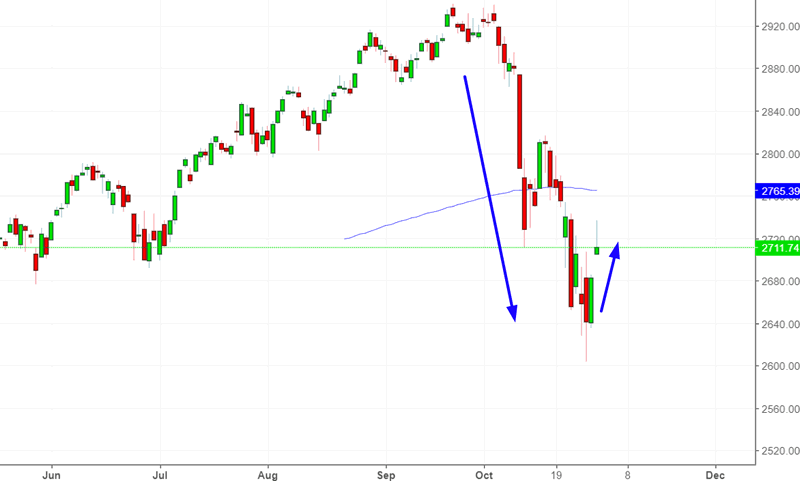
The S&P 500 has bounced strongly over the past 2 days.
After falling to a 5 month low, the S&P went up more than 1% for two days in a row. That’s quite a rapid reversal.
Here’s what happened next to the S&P 500 when it fell to a 5 month low and then went up >1% for 2 consecutive days.
*Data from 1927 – present
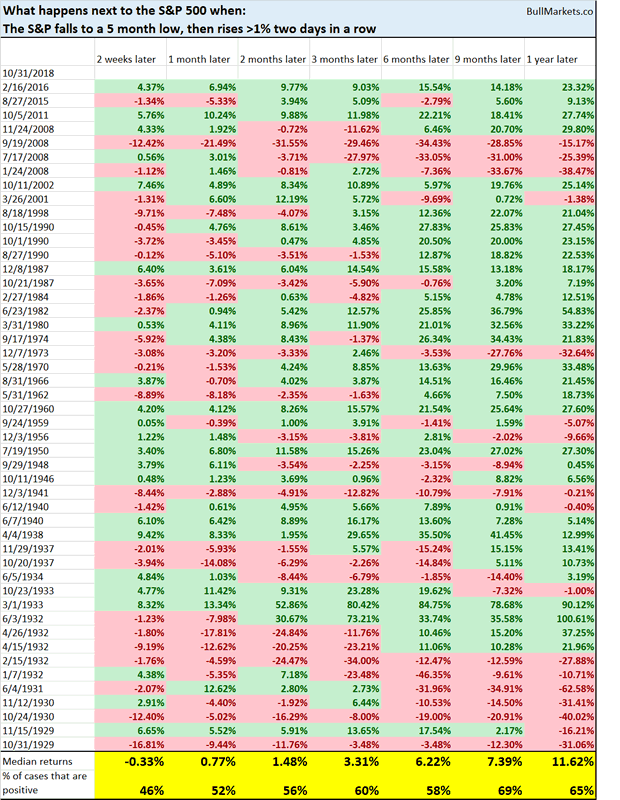
As you can see, the S&P 500 has a slight tendency to fall more over the next 2 weeks. Bounces don’t often succeed on their first try.
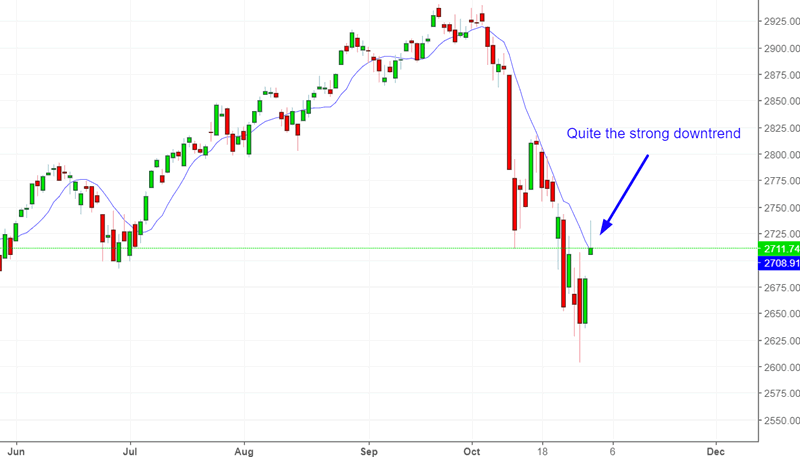
A long downtrend
The S&P 500 has closed above its 10 day moving average for the first time in 20 days. In other words, a fierce and nonstop downtrend is slowing down. Is this a breakout?
Here’s what happened next to the S&P 500 when it closed above its 10 day moving average for the first time in 20 days.
*Data is from 1927 – present
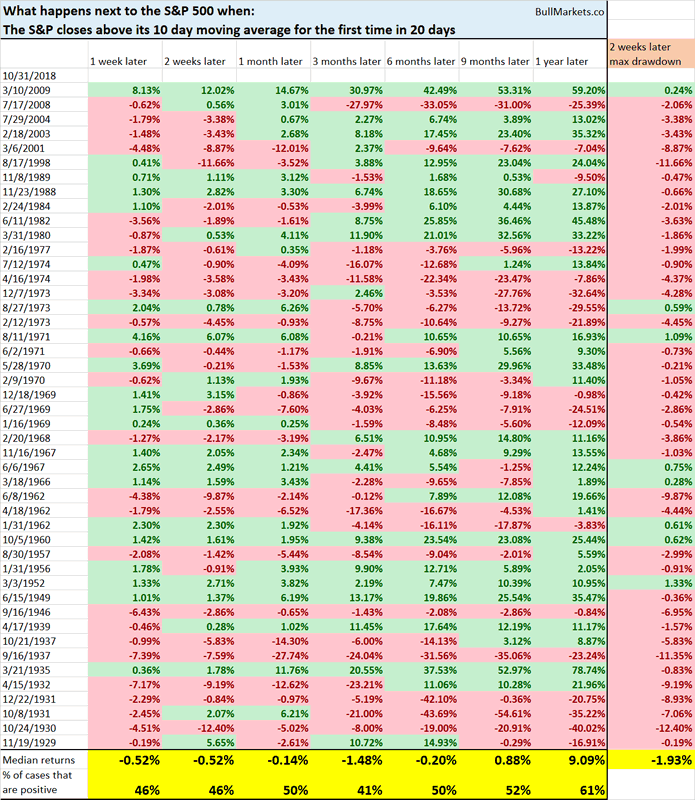
As you can see, the S&P 500 tends to fall a little 2 weeks later and 3 months later. However, both of the declines are small (median is -1%)
As you can see in the above chart, many of these cases happened when the S&P was deep in a bear market (i.e. had already tanked 30%+).
Let’s narrow down the cases to ones in which the S&P was within 10% of a 1 year high.
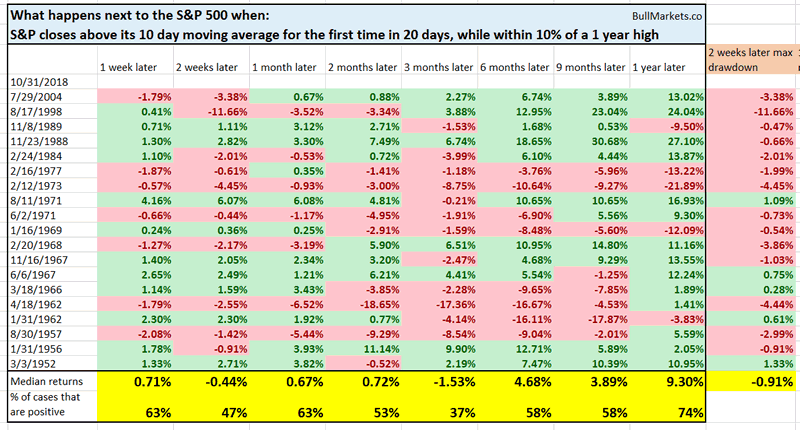
Here the sistuation changes a little. The 2 week forward returns are almost no better than a 50-50 coin toss, whereas the 3 month forward returns are slightly bearish (median returns at -1.5%).
This study is interesting: it’s one of the few 3 month forward bearish studies we’ve seen recently.
The key point to remember is that you’re never going to have a case in which 100% of studies are bullish or 100% of studies are bearish. What matters is whether the MAJORITY of studies are bullish or bearish.
Click here to see yesterday’s market study
Conclusion
Our discretionary technical outlook has changed a little:
- The current bull market will peak sometime in Q2 2019.
- The medium term remains bullish (i.e. trend for the next 6-9 months). Volatility is extremely high right now. Since volatility is mean-reverting and moves in the opposite direction of the stock market, this is medium term bullish.
- The short term is slightly bearish. There’s a slightly >50% chance that the S&P will retest its lows from a few days ago. This probability isn’t exceptionally high, so I wouldn’t bank on it.
- When the stock market’s short term is unclear (as it is most of the time), focus on the medium term. Step back and look at the big picture. Don’t lose yourself in a sea of noise.
Our discretionary outlook is usually, but not always, a reflection of how we’re trading the markets right now. We trade based on our clear, quantitative trading models, such as the Medium-Long Term Model.
Members can see exactly how we’re trading the U.S. stock market right now based on our trading models.
Click here for more market studies
By Troy Bombardia
I’m Troy Bombardia, the author behind BullMarkets.co. I used to run a hedge fund, but closed it due to a major health scare. I am now enjoying life and simply investing/trading my own account. I focus on long term performance and ignore short term performance.
Copyright 2018 © Troy Bombardia - All Rights Reserved
Disclaimer: The above is a matter of opinion provided for general information purposes only and is not intended as investment advice. Information and analysis above are derived from sources and utilising methods believed to be reliable, but we cannot accept responsibility for any losses you may incur as a result of this analysis. Individuals should consult with their personal financial advisors.
© 2005-2022 http://www.MarketOracle.co.uk - The Market Oracle is a FREE Daily Financial Markets Analysis & Forecasting online publication.