


The U.S. Stock Market is Very Volatile Right Now. What’s Next
Stock-Markets / Stock Markets 2018 Nov 01, 2018 - 05:48 PM GMTBy: Troy_Bombardia

The U.S. stock market has been very volatile recently, swinging up and down more than 1% each day.
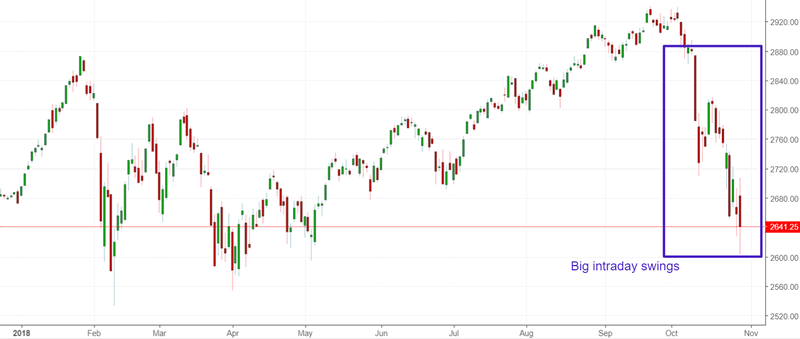
From September 2018 – present the S&P has fallen -10.8%, while from January – February 2018 the S&P fell -11.8% (using daily HIGH and LOW prices). So the magnitude of these 2 corrections has been very similar.
Let’s analyze the stock market’s price action by objectively quantifying technical analysis. For the sake of reference, here’s the random probability of the U.S. stock market going up on any given day, week, or month.

*Probability ≠ certainty. But if you consistently trade against probability, then you will underperform in the long run.
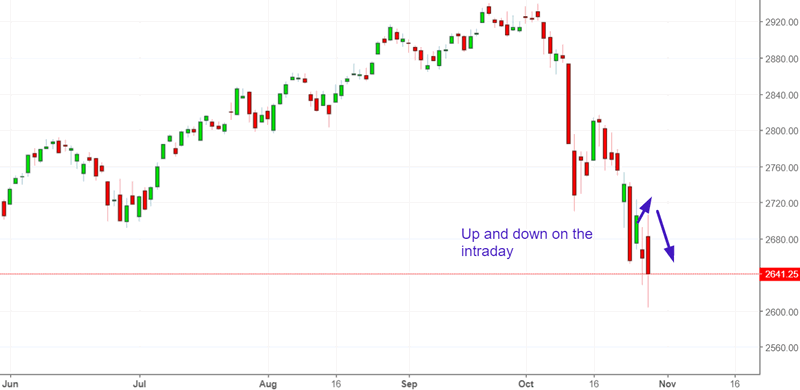
S&P 500 has been very volatile during the intraday
The U.S. stock market went up more than 1.8% yesterday, and then closed more than -0.5% below the previous day’s close. That kind of intraday volatility is uncommon.
Is this a sign of “holy shit there are no buyers out there!!!!”?
Here’s what happened next to the S&P 500 when the S&P’s daily high is more than 1.8% above yesterday’s close, and the S&P’s CLOSE is more than -0.5% below yesterday’s CLOSE (i.e. a big failed bounce)
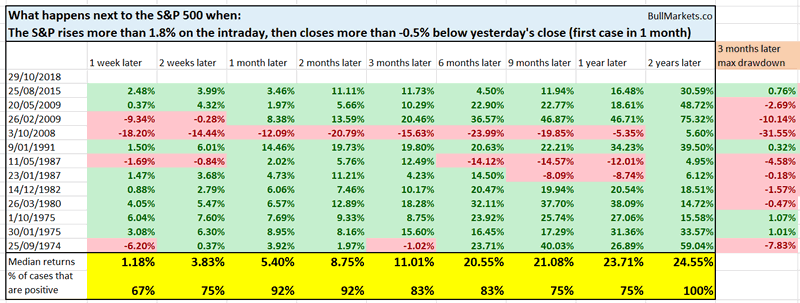
As you can see, the S&P tends to go up 1-3 months later. Somebody is trying to buy the dip. It doesn’t always succeed on the first try, but eventually it does.
“This stock market crash is just like the dot-com top!!!!”
The S&P has gone down in 21 out of the past 27 trading days.
I saw this one very popular tweet on Twitter saying “in the past 35 years, there has only been 1 other case in which the S&P fell 21 out of the past 27 days – that was November 2000”
Financial media, permabears, and other “the world is ending” people love to use n=1 “bearish” studies. It allows them to “prove” that the world is ending. Bad new is good for attracting media attention and ad $$$.
Here’s the actual data.
This is what happened next to the S&P 500 when it fell at least 21 out of the past 27 trading days (excluding overlaps), from 1928 – present.
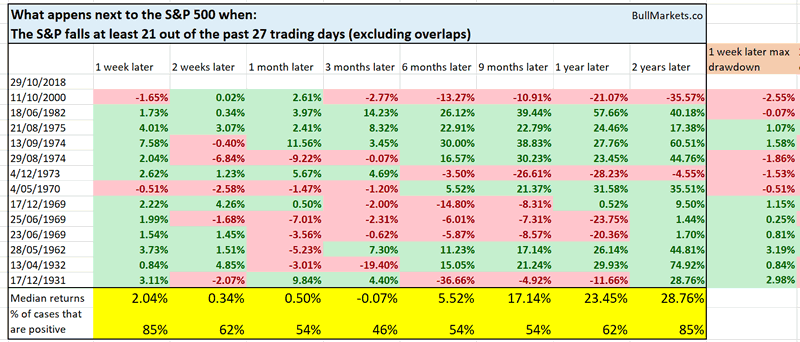
As you can see, this does not quite support the whole “stock market will crash” story. But hey, never let the truth get in the way of a good story, right?
Breadth is weak, but the short term is neither consistently bullish nor bearish
Our recent studies demonstrate that the stock market’s medium term outlook is bullish (i.e. ~ 3-6 months), but the short term is mixed. Some studies are bullish, while others are bearish.
The S&P 500’s Bullish Percent Index is a breadth indicator. The S&P 500’s Bullish Percent Index is now at 31.
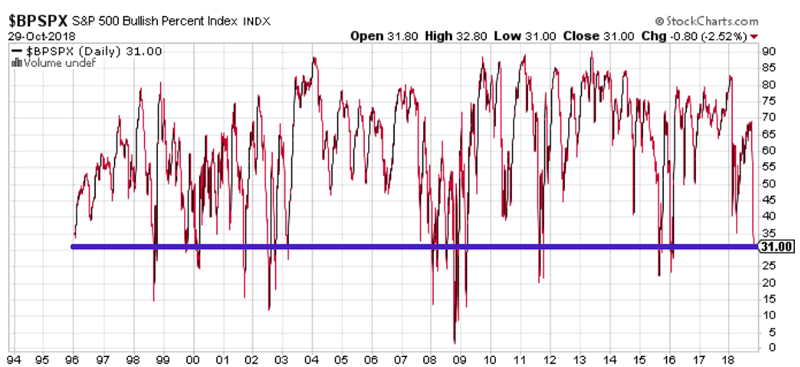
Here’s what happened next to the S&P 500 when its Bullish Percentage Index fell to 31 or less for the first time in 3 months.
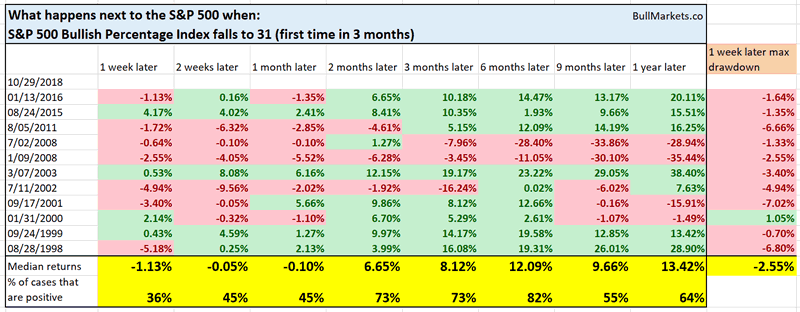
As you can see, the stock market tends to fall even more over the next 1 week, although not by a lot.
Likewise, the NYSE Composite’s Bullish Percent Index is now very low (currently below 34).
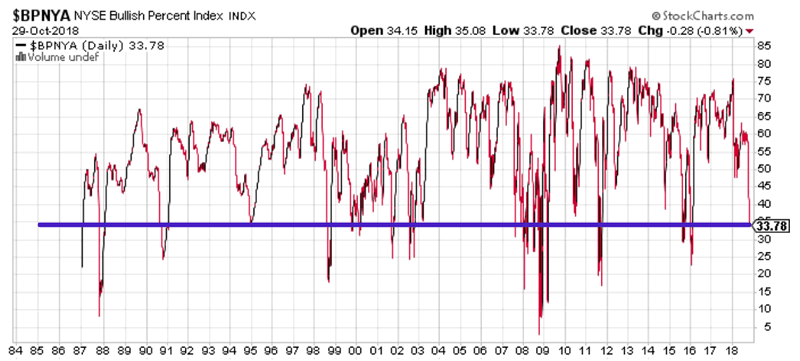
Here’s what happened next to the NYSE Composite when its Bullish Percentage Index fell below 34 for the first time in 3 months.
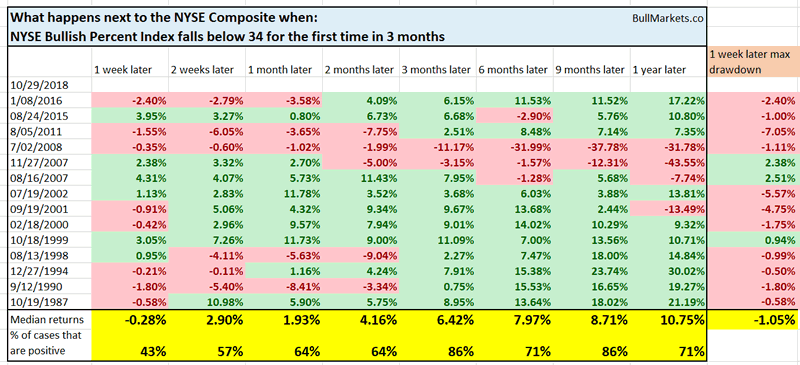
As you can see, the NYSE Composite also has a slight tendency to fall more over the next 1 week.
Now let’s move onto the short term bullish studies.
Yesterday, the S&P made a big “outside day”. Its daily HIGH was more than 0.5% above the previous day’s HIGH, and the daily LOW was more than -0.9% below the previous day’s LOW.
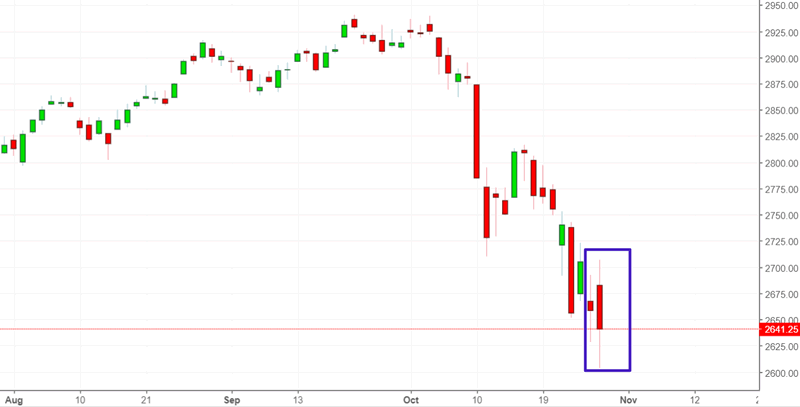
Here are similar instances, and what the S&P 500 did next.
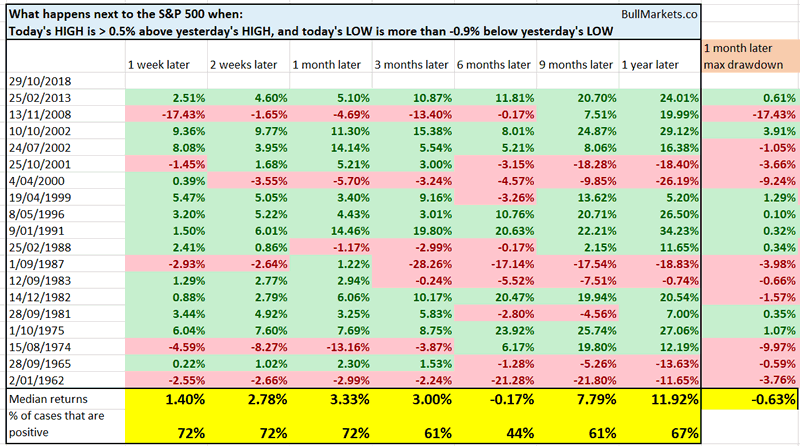
As you can see, this goes against the previous 2 studies that were short term bearish for the U.S. stock market.
And lastly, I want to talk about valuations.
Permabears consistently point to “holy shit valuations are ridiculously high!!!!! This is another bear market like the dot-com crash!!!!”. That’s an argument they’ve been making for 8 years in a row, and I think 2019 will be the first year in which they are correct. 1 out of 8 success rate. Not bad.
It’s important to look at interest rates when looking at valuations. This is a point that Warren Buffett and Scott Minerd have said for years. Valuations are high mostly because interest rates are low.
Here is a chart from Guggenheim demonstrating that when you take into account interest rates, valuations are actually below average. The dot-com top saw much higher valuations combined with higher interest rates.
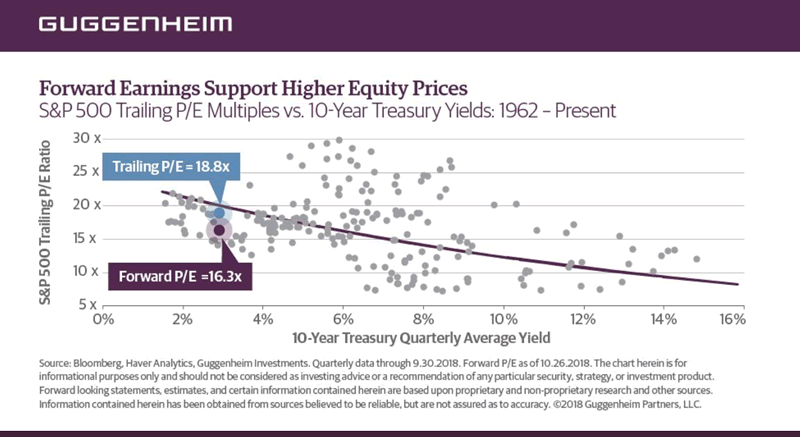
While interest rates are rising right now, they are by no means “soaring”. Now let’s assume that the 1 year yield goes up another 1% (which is quite a big jump). Based on current valuations (16.3x forward P/E and a 4.1% 10 year yield)…..
It’s fair value.
Valuations don’t drive bull and bear markets. The economy does. By definition, valuations are going to expand in a bull market and contract in a bear market (because the stock market moves faster than earnings). That’s just stating a fact.
Conclusion
Our discretionary technical outlook remains the same:
- The current bull market will peak sometime in Q2 2019.
- The medium term remains bullish (i.e. trend for the next 6-9 months). Volatility is extremely high right now. Since volatility is mean-reverting and moves in the opposite direction of the stock market, this is medium term bullish.
- The short term is a 50-50 bet right now. Moreover, the stock market will probably remain volatile in the short term (big up and down swings).
- When the stock market’s short term is unclear (as it is most of the time), focus on the medium term. Step back and look at the big picture. Don’t lose yourself in a sea of noise.
Our discretionary outlook is usually, but not always, a reflection of how we’re trading the markets right now. We trade based on our clear, quantitative trading models, such as the Medium-Long Term Model.
Members can see exactly how we’re trading the U.S. stock market right now based on our trading models.
Click here for more market studies
By Troy Bombardia
I’m Troy Bombardia, the author behind BullMarkets.co. I used to run a hedge fund, but closed it due to a major health scare. I am now enjoying life and simply investing/trading my own account. I focus on long term performance and ignore short term performance.
Copyright 2018 © Troy Bombardia - All Rights Reserved
Disclaimer: The above is a matter of opinion provided for general information purposes only and is not intended as investment advice. Information and analysis above are derived from sources and utilising methods believed to be reliable, but we cannot accept responsibility for any losses you may incur as a result of this analysis. Individuals should consult with their personal financial advisors.
© 2005-2022 http://www.MarketOracle.co.uk - The Market Oracle is a FREE Daily Financial Markets Analysis & Forecasting online publication.