


The US Housing Market 4 Year Cycle – More Falls Expected
Housing-Market / Cycles Analysis Mar 28, 2007 - 09:01 PM GMTBy: Tim_Wood

It seems that of late that a major topic being covered by the mainstream media is “sub-prime” mortgages and the related scare of the downstream impact. Well, the charts warned of problems in the home building sector a year and a half ago. In fact, I first reported in October 2005 that the charts were showing signs of trouble for the housing market. In the February 2006 I also reported on the further technical problems and developments for the housing sector.
Then, in the May 19, 2006 I followed up again on the housing sector and reported that the evidence from the intermediate-term charts had continued to evolved to the point that the longer-term trend had topped. I went on to give very specific cyclical high and low points to watch for as continued confirmation of my thesis. My point here being, the charts were right and the mainstream media once again failed to warn and even refused to acknowledge a housing bubble. That is until now when the problem becomes obvious.
Now, I once again want to follow up on the housing sector and take a look at what the charts are currently saying. The first chart below is a weekly chart of the Dow Jones Home Construction Index. I have marked each of the intermediate-term cycle lows since March 2003 with a blue “I” that is outlined in red. The 2004 intermediate-term cycle low came in May, the 2005 intermediate-term cycle low came in April and the 2006 low occurred in July.
I have also included my intermediate-term Cycle Turn Indicator in blue and my Trend Indicator is in green and red. When the green is above the red, it is confirming an intermediate-term up trend and when the red is above the green it is confirming an intermediate-term down trend. When the Cycle Turn Indicator is moving in the same direction as the Trend Indicator, it is telling us that we have trend uniformity. When the Cycle Turn Indicator is moving in the opposite direction of the Trend Indicator it is telling us that we have a corrective move underway. That being said, let's now see what the charts are presently saying.
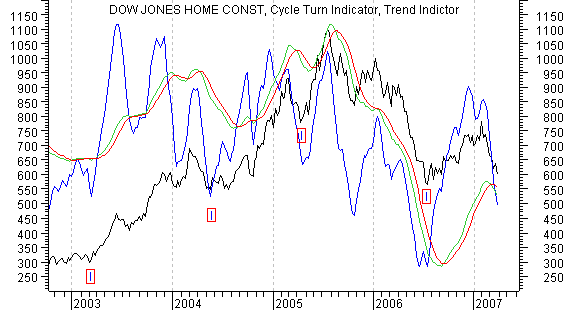
First, I want to point out that the intermediate-term cycle lows tend to occur in the spring to early summer timeframe, with the most recent intermediate-term cycle low occurring last July. From there this index moved up into the February 2007 cycle high. As you can see, both the Cycle Turn Indicator and the Trend Indicator have turned down. This is telling us that the decline from February is not a counter-trend move, but rather the decline out of the most recent intermediate-term cycle top. Now the question is, “Where will the coming intermediate-term cycle low occur?” Well, we know that there is a pattern in which the lows occur in the spring or early summer, so this is obviously one hint and we are approaching that timeframe now. So, this offers some reason of hope. But, on the negative side of this equation we now have the Trend Indicator that has just turned down on the weekly/intermediate-term chart, which is telling us that this correction is only just beginning. If so, then we may still be a few months from the low.
To simplify this matter all we really have to do is follow the Cycle Turn Indicator. When it turns up, we will then know that at least a short-term low has been reached and then we watch to see if that strength is sufficient enough to turn the Trend Indicator back up. If so, at that point we will know that the intermediate-term low has been made, but until such time, lower prices are expected.
The next important item to watch and understand is the price level in which the coming intermediate-term cycle low occurs. Note that the 2004 intermediate-term cycle low occurred at a level that was higher than the 2003 low and that the 2005 low occurred at a level above the 2004 cycle low. From a cyclical perspective, this meant that the longer-term trend was up. The problem then came when the decline out of the 2005 high moved below the April 2005 intermediate-term cycle low. Long story short, when the April 2005 cycle low was violated it told us that the longer-term cycle had turned down.
Now, let me point out that the February 2007 cycle high occurred at a lower level than the previous cycle high. Thus, we now have a lower cycle low and a lower cycle high. The lower cycle high adds another layer of confirmation that the longer-term cycle has turned down in that a lower high has now followed a lower low of the same degree cycle. I want to add here that both the long-term monthly Trend and Cycle Turn Indicators are also negative. These negative indicators serve to confirm what the cyclical or structural breakdown is telling us.
With this rather negative picture now painted I want to point out that as I read these charts, the price/indicator picture is clearly negative and lower prices are expected until the indicators turn back up. The key is the price level in which this low occurs. If the July 2006 intermediate-term cycle low is not violated with the current probe down as price searches for the coming cycle low, then at that point we will have our first indication that the longer-term trend has turned back up. I would of course want this confirmed by the longer-term indicators as well. However, should the ongoing decline into the coming intermediate-term cycle low violate the July 2006 low, then that violation will serve as structural evidence that the longer-term trend is still moving down. In the meantime, as we await this verdict and the possibility of a higher low, we know that the current price/indicator picture is negative and that lower prices are expected to follow into the coming cycle low.
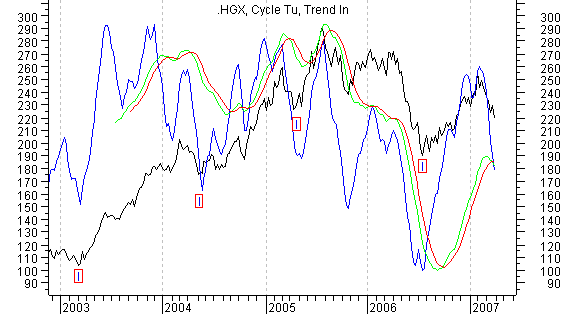
Next, I have included a weekly chart of the Philadelphia Housing Index and here the cyclical/structural and indicator picture is pretty much identical to that of the Dow Jones Home Construction Index.
Now I want to share a monthly chart with you showing an interesting correlation between housing starts and bull market periods in the stock market. This chart can be found below. Let's begin with the bull market period in which the stock market topped out in 1966. In this case, housing starts topped 2 years prior to the market. Then, note that as the stock market began moving up out of its 1966 4-year cycle low, housing starts expanded, but fell short of their previous high.
As the stock market rolled over into its 1970 4-year cycle low, housing starts again contracted. But, then as the market expanded up out of the 1970 4-year cycle low and into the 1973 rally separating Phase II from Phase III of that bear market, money again poured into housing. As you can see by the housing start numbers, that housing boom was greater than the most recent housing boom. Now take note that the 1973 stock market top was preceded by not only a great housing boom, but also housing starts topped out ahead of the stock market by one full year.
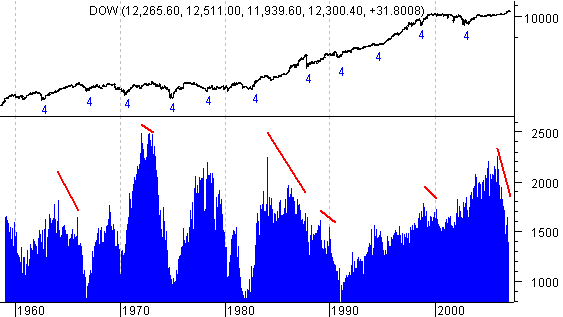
Next, look how both housing starts and the stock market contracted into the 1982 4-year cycle low. From that low, both began to rise. Housing starts however topped out in early 1984. This time around the lagging housing starts lead the stock market by 3-years, but this nonetheless lead to the 1987 decline. Housing then finally hit bottom at the 1990 4-year cycle low and again began climbing with the stock market as it moved up out of that low. That expansion ran all the way to December 1998. This was 26 months prior to the January 2000 stock market top.
So, once again we saw that a contraction in housing lead the stock market. But, just as occurred in association with the bear market declines of the late 1960's and into the early 1970's, when the stock market faltered, the money poured into housing. This was also encouraged by the sea of liquidity created by the fine folks at the Fed with their massive save “the stock market” campaign that began in early 2001. Anyway, housing starts topped out in January 2006 and have been lagging the stock market since. So, here we sit with the statistics telling us that the 4-year cycle low is still ahead of us, we have had the weekly Cycle Turn Indicator warning of trouble for weeks and we just saw a 533 point loss in a single week. This is all occurring in conjunction with a contraction in housing starts. If history has any bearing on the current set up, this contraction in housing starts is once again telegraphing the decline into the 4-year cycle low just as I have been saying all along. Personally, I feel that this longer-term comparison between housing starts and the stock market is another important piece of data that can be used to help us understand the environment that we are in.
By Tim Wood
Cyclesman.com
© 2007 Cycles News & Views; All Rights Reserved
Tim Wood specialises in Dow Theory and Cycles Analysis - If you are interested in a statistical and technical based source that also utilizes Dow theory and provides statistical probabilities as to what should occur, then Cycles News & Views may be for you. I also provide web-based updates giving short and intermediate-term turn points on the stock market, gold, bonds and the dollar, utilizing my Trend and Cycle turn Indictors. A subscription also includes short-term updates three nights a week. Please see www.cyclesman.com/testimonials.htm
© 2005-2022 http://www.MarketOracle.co.uk - The Market Oracle is a FREE Daily Financial Markets Analysis & Forecasting online publication.