


Stock Market Crash: Time to Buy Stocks?
Stock-Markets / Stock Markets 2018 Oct 12, 2018 - 07:26 PM GMTBy: Troy_Bombardia

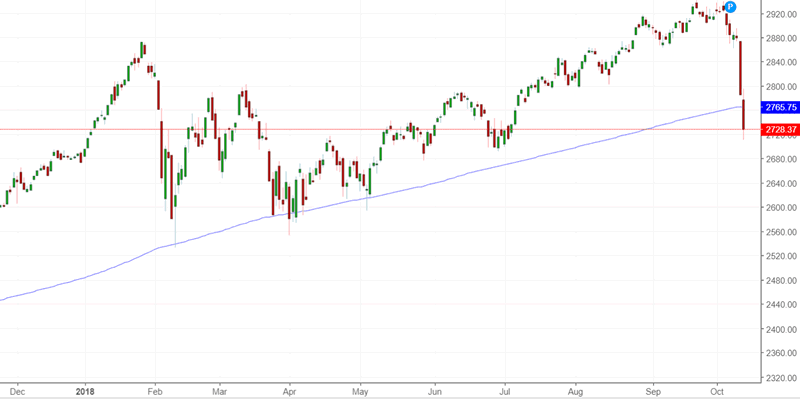
 In yesterday’s market study I said that the U.S. stock market would probably fall a little more. Upon further analysis, I said that the S&P would probably fall below its 200 dma to at least 2729.
Lucky call or not, that’s exactly what the S&P did today.
If you’re a long term trader/investor, then this is a decline to ignore. It never ceases to amaze me how people think that the world is ending because the stock market fell 7% (which happens twice a year, on average).
If you’re a short term trader, the question is obvious: should you buy?
Start buying now by scaling in
The key to trading is focusing on risk:reward.
As I said yesterday, these sort of mini-crashes don’t usually resolve themselves in 1 day. The market usually chops around (sometimes with a bullish momentum divergence) for 1-2 months before heading higher.
With that being said,
- The medium term risk:reward is very bullish.
- The short term risk:reward is mixed (because bottoms are a choppy process), but it leans bullish right now.
Here’s the data for why stocks will go up
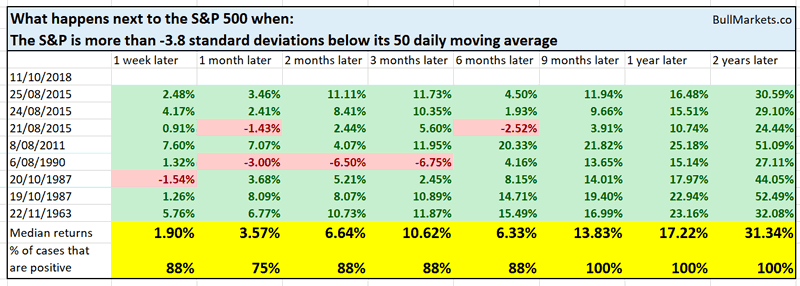
For starters, the S&P 500 is now more than -3.8 standard deviations below its 50 day moving average (i.e. massive gap down below its lower Bollinger Band).
As you can see, this is EXTREMELY bullish for the stock market medium term and long term. And for those who think that the stock market will “crash like 1987”, this signal came out AFTER the 1987 crash.
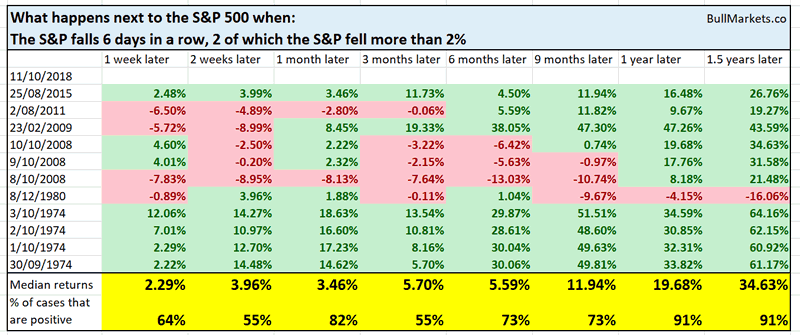
Meanwhile, the S&P 500 is down 6 days in a row, while falling more than 2% during 2 of these 6 days. In other words, a bit of panic selling.
Historically, this marks EXTREME FEAR in the stock market. This happened at a lot of medium term major bottoms for the U.S. stock market:
- August 2015
- August 2011
- February 2009
- October 2008 (after which the S&P made a big 20% bear market rally)
- etc
Balls-to-the-walls short VIX?
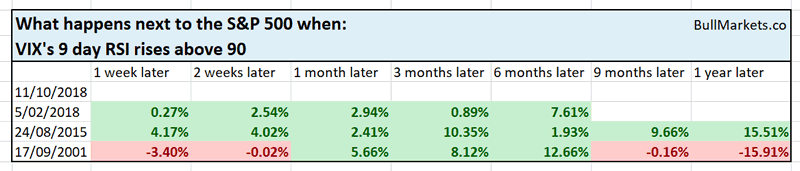
VIX (volatility index) continues to spike. VIX is mean-reverting.
VIX’s 9 day RSI is now above 90! Historically, this pretty much marks the top in VIX…
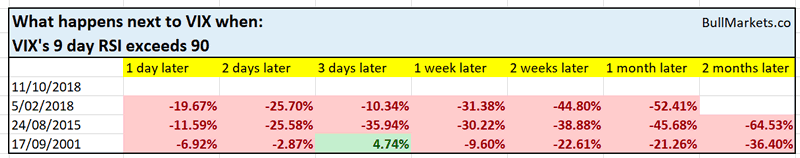
… and bottom in S&P.
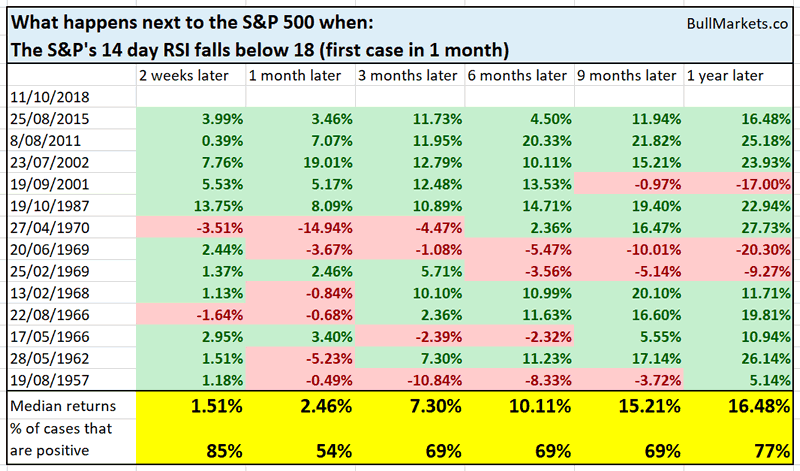
Momentum is extremely oversold
Contrarian momentum indicators are extremely oversold right now.
The S&P’s 14 day RSI is now below 18. This means that the U.S. stock market’s short term downside (over next 1-2 weeks) is limited.
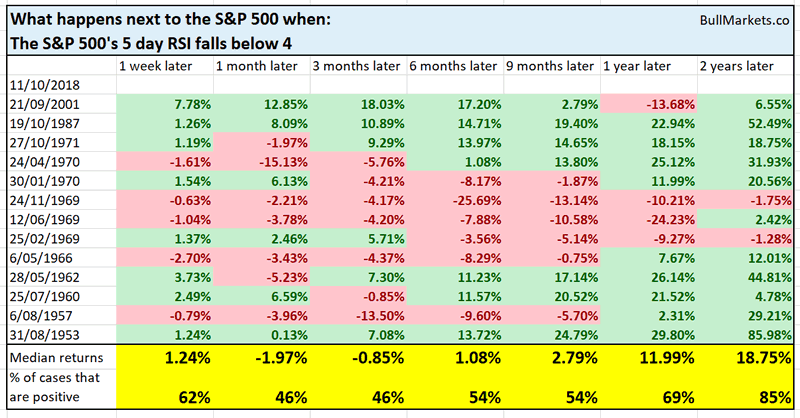
Meanwhile, the S&P’s 5 day RSI is below 4. This is as low as it gets, and the S&P almost always rebounds over the next few days.
However, “extremely oversold” RSI can lead to more choppiness in the short term (i.e. bullish RSI divergence).
Sentiment
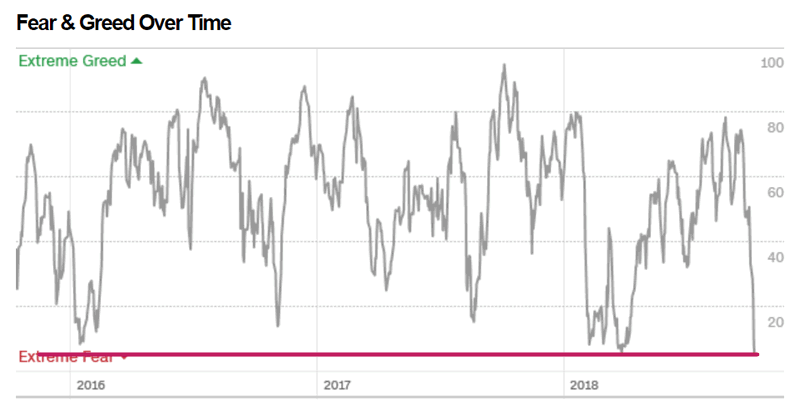
Sentiment is starting to exhibit “extreme fear”. (Sentiment is a contrarian indicator. Extreme fear = bullish).
CNN’s Fear & Greed Index is now at 5!
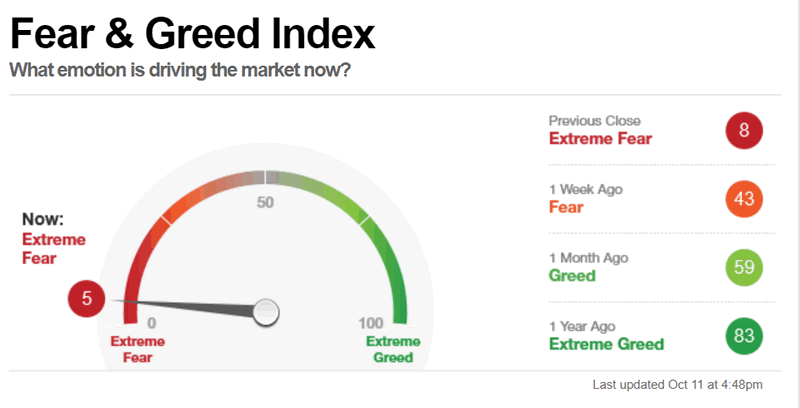
The Fear & Greed Index is now lower than it was in February 2016 and February 2018!
Conclusion
When the market crashes:
- Stay calm and unemotional
- Focus on facts and data
- Focus on risk:reward
- Know your trading plan/model, and stick to it.
Right now, the facts and data are telling us:
- Could the stock market fall some more in the short term? Of course. Nobody can pick the exact bottom.
- The short term risk:reward leans bullish.
- The medium term risk:reward is even more bullish.
- The road higher will not be easy. There will be a lot of chop along the way.
Those in the Membership Program can see how we’re trading the stock market’s crash.
And lastly, some funny things to brighten your day
CNBC and Donald Trump
CNBC has FINALLY decided to deliver their “Markets in Turmoil” special tonight. Experienced traders now that when CNBC does this, it’s a good contrarian sign to buy (they’ve delivered this report at a lot of market bottoms).
Meanwhile, Donald Trump is raging about the stock market (and the Fed).
Historically, when CNBC releases “Markets in Turmoil” and Trump starts to rage, the stock market tends to bottom. That’s pretty much been the pattern from 2016 – present.
Meanwhile, the stock market has made a “vomiting camel formation”. Time to run for the hills guys
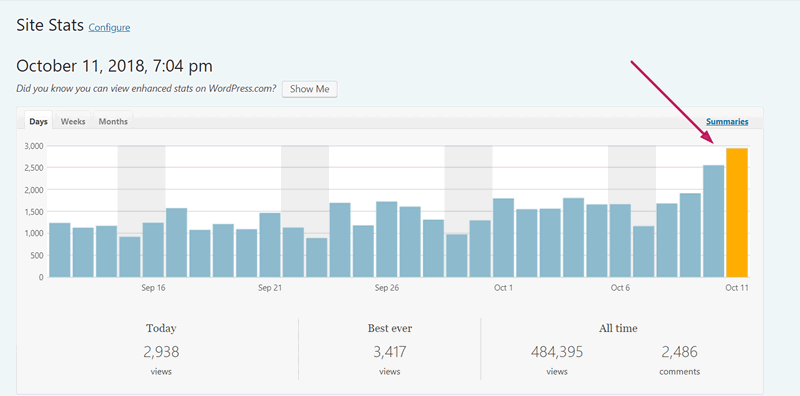
And lastly, here’s the web traffic for BullMarkets.co today (notice how it’s only at 7 pm). The last time it was this high was the exact February 2018 bottom.
Click here for more market studies
By Troy Bombardia
I’m Troy Bombardia, the author behind BullMarkets.co. I used to run a hedge fund, but closed it due to a major health scare. I am now enjoying life and simply investing/trading my own account. I focus on long term performance and ignore short term performance.
Copyright 2018 © Troy Bombardia - All Rights Reserved
Disclaimer: The above is a matter of opinion provided for general information purposes only and is not intended as investment advice. Information and analysis above are derived from sources and utilising methods believed to be reliable, but we cannot accept responsibility for any losses you may incur as a result of this analysis. Individuals should consult with their personal financial advisors.
© 2005-2022 http://www.MarketOracle.co.uk - The Market Oracle is a FREE Daily Financial Markets Analysis & Forecasting online publication.