


SPX/Gold Ratio, Long-term Yields & Yield Curve
Stock-Markets / Financial Markets 2018 Oct 05, 2018 - 02:47 PM GMTBy: Gary_Tanashian

It has been a long while since the last Amigos update because frankly if the characters, images and shticks I invent to portray market status begin to wear on me sometimes I have to believe they may do the same to you. Consider that the 3 Amigos, SPX/Gold Ratio, Long-term Yields and the Yield Curve are slow movers that we usually view from monthly chart perspectives and well, sometimes you need to take a break and just let them do their thing over time.
But with yesterday’s smash above the Continuum’s ™ limiter, the long bond’s yield has set things in motion and it is time to update all three macro indicators in detail. Many months ago we asked this following question of Amigo #2 (long-term Treasury yields).
In honor of Amigo #2 being the first one to trigger a signal, he gets to lead off our update today.
What #2 was bracing for was the first approach of the limiter (100 month exponential moving average) that had halted all advances in 30 year Treasury yields for decades. Now it is 8 months later and the yield finally cracked above the red dashed limiter. As noted in the post linked above, it has done this on several occasions over the course of the declining yields continuum. Most recently during the mini inflation hysteria and blow off of Q1 2011. Technically speaking, TYX would need to close October above the red line in order to make a positive breakout signal that it failed to do on the 4 most recent stabs above the limiter.
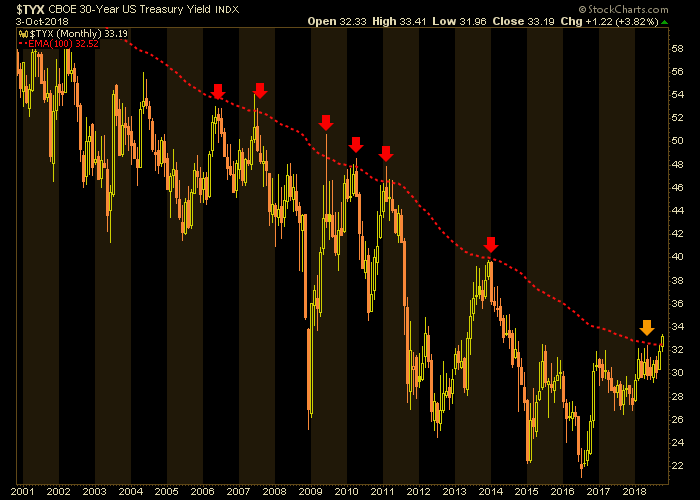
Why is this so important? Well, aside from the fact that rising rates on the long end would eventually impair a debt-leveraged economy rising interest rates could indicate the return of an inflation problem. If you believe that all that monetary stimulus summoned by Ben Bernanke after the last crisis has settled into the economy’s bones (as opposed to magically and harmlessly disappearing through gradual QT and Fed rate hikes) then you are planning for either a whopper of an inflation problem if the breakout is real or a whopper of a head fake into a potential deflationary liquidation if it is not.
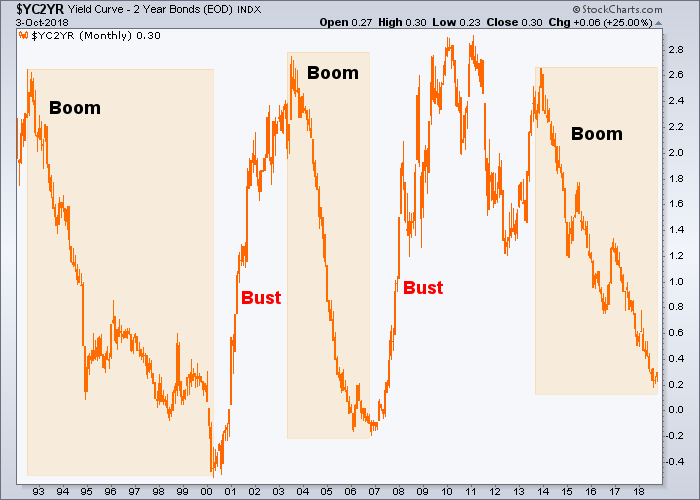
But #2 has running mates that will help inform the macro and I am going to go completely out of order here and take a look at Amigo #3, the Yield Curve, because it is closely related to #2 and the question of ‘inflation or deflation?’. That is because long-term yields can rise in relation to short-term yields under pains of inflation (as bond yields are driven up in response on the long end) or deflation (as bond yields are driven down by a flight to safety bid on the short end). Either way, a flattened yield curve that begins steepening is going to mean significant issues in some areas.
The daily Yield Curve has bounced in the direction of steepening. It not surprisingly did the same ahead of the February market correction.
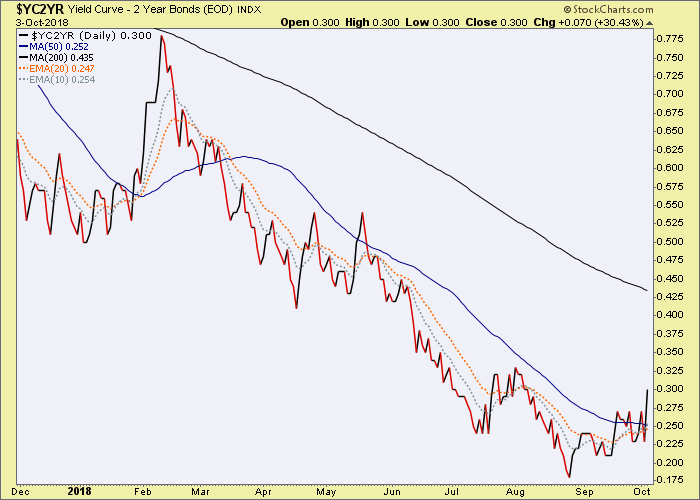
But The bigger trend is still flattening. I read an article about Stanley Druckenmiller this morning, in which he bemoans the rise of the machines (of passive investing) and how it is screwing up his market management system. I can see his point, and have noticed the same effect. But that is why we have indicators like this. As long as the curve is flattening a boom (and all that goes with it, like a bull market in stocks) is likely in effect. You cannot argue with it. The caveat is that trend changes have to start somewhere. So, is that just a bounce on the daily chart above? Time will tell.
But there is little doubt that the boom is mature. At the end of the article linked above is a video interview of Ray Dalio. I highly recommend you listen. He notes we are in the late innings (he estimates the 7th of 9) of this boom and more importantly, explains some valid reasons why.
But as long as Amigo #3 has been trending month after month to a flattening condition a bullish indicator has remained intact. Now, if long-term yields (#2) are making a real move the Yield Curve comes into play as it can steepen under the stress of inflation or deflation.
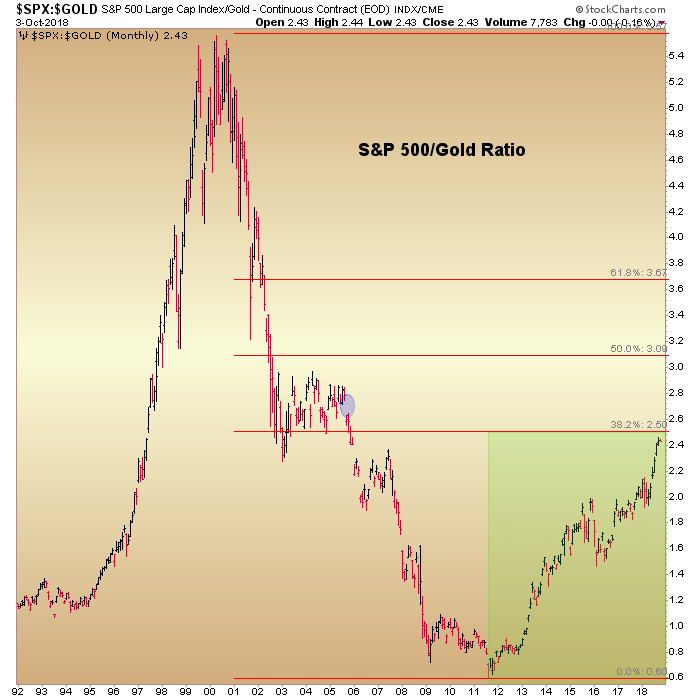
Finally, the ultimate arbiter of macro risk (on or off) is Amigo #1, the SPX/Gold Ratio. Gold topped out in 2011 and with it the risk ‘off’ trades were banished as the S&P 500 has been in a process of repairing the financial terror from 10 years ago (happy anniversary to all of us who were there in real time, as NFTRH launched on September 28th, 2008).
As you can see, risk remains ‘on’ but at the same time risk is very high. The two conditions can and should coexist ever more closely the higher this indicator goes. As with a steepening Yield Curve, a declining SPX/Gold ratio can be an indicator of an inflationary or deflationary backdrop. As of now, it is on a near vertical upward drive to the first objective (I won’t call it resistance, because I don’t believe a ratio can have a technically identifiable resistance point). That is the 38% Fib retrace area at 2.50. But I do wonder about that gap up there, which could easily be filled if stock market momentum continues. Alternately, it could fill later after an interim market correction.
Bottom Line
- Amigo #2 (Long-term Treasury Yields) was the first to get to its destination, which was the 30yr yield’s monthly EMA 100. Now it is the first to make a macro signal. Being in-month, we’d need it to close October in this condition to minimize the potential that it is a whipsaw or false macro signal (ref. the inflation hysteria of Q1, 2011).
- Amigo #3 (Yield Curve) would then likely cease its flattening trend and steepen under pressure of inflation or deflation. Long-term yields and inflation expectations gauges will be used to decide on that. But either way, the boom would be over if economic contraction and/or deflation takes hold or at best investment could shift radically if an inflationary steepening were to take hold.
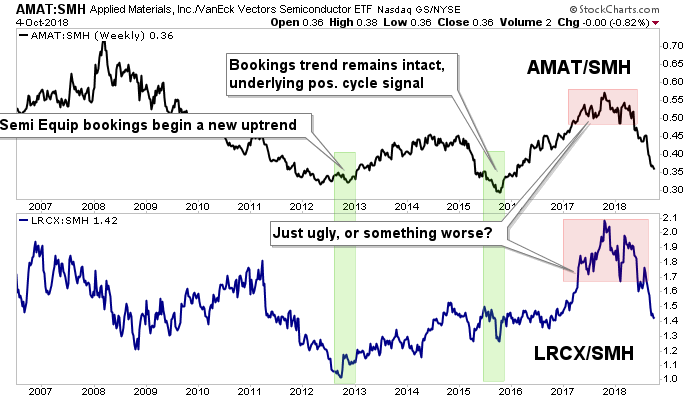
- Amigo #1 (SPX/Gold Ratio) is very extended and indicates the latter stages of the risk ‘on’ trade that began in 2011 and really took hold in 2013 (not coincidentally, when we began our positive cycle analysis in the Semi Equipment sector).*
These monthly charts move with sloth-like drudgery, so patience and ongoing perspective are always needed. We’ll use shorter-term tools to refine the… short-term!
* That would be the same Semi Equipment sector currently giving a macro warning 5+ years later.
Subscribe to NFTRH Premium (monthly at USD $33.50 or a 14% discounted yearly at USD $345.00) for an in-depth weekly market report, interim market updates and NFTRH+ chart and trade setup ideas, all archived/posted at the site and delivered to your inbox.
You can also keep up to date with plenty of actionable public content at NFTRH.com by using the email form on the right sidebar and get even more by joining our free eLetter. Or follow via Twitter ;@BiiwiiNFTRH, StockTwits or RSS. Also check out the quality market writers at Biiwii.com.
By Gary Tanashian
© 2018 Copyright Gary Tanashian - All Rights Reserved
Disclaimer: The above is a matter of opinion provided for general information purposes only and is not intended as investment advice. Information and analysis above are derived from sources and utilising methods believed to be reliable, but we cannot accept responsibility for any losses you may incur as a result of this analysis. Individuals should consult with their personal financial advisors.
Gary Tanashian Archive |
© 2005-2022 http://www.MarketOracle.co.uk - The Market Oracle is a FREE Daily Financial Markets Analysis & Forecasting online publication.