


Predictive Trading Model Suggests Falling Stock Prices During US Elections
Stock-Markets / Stock Markets 2018 Sep 18, 2018 - 06:11 PM GMTBy: Chris_Vermeulen

 Just in time for what appears to be a potentially massive market price rotation, our researchers have put together this post to highlight what we believe will become a surprise price correction in the US Equities markets. Our team of researchers believes the correlation of our predictive modeling tools, predictive cycle tools, and other indicators are set up for what may become a massive 5~8% price rotation over the next 60 days.
We were expecting this rotation to start unfolding around mid-September (now) but at this time the technical are still bullish so we are not betting against the market just yet.
The combination of new US tariffs ($200 Billion about to hit in the China trade war), as well as a combination of technical issues with regards to Technology Stocks and retail expectations, could jolt the market if a correction does take place as our predictive modeling tools suggest. A simple rotation of 2~3% is fairly common in the markets. These predictive modeling solutions are suggesting we are just 4~5 days away from the start of a much bigger correction in the US Equities and Indexes.
We believe the coming US elections in combination with the other aspects of the global economy are going to drive a downward price correction that many people are not expecting right now. But there is one pocket of stocks that could benefit from this tariff stuff which members or our Wealth Building Newsletter just got long today!
Anyway, Let’s take a look at some of our index charts to see how this will likely play out.
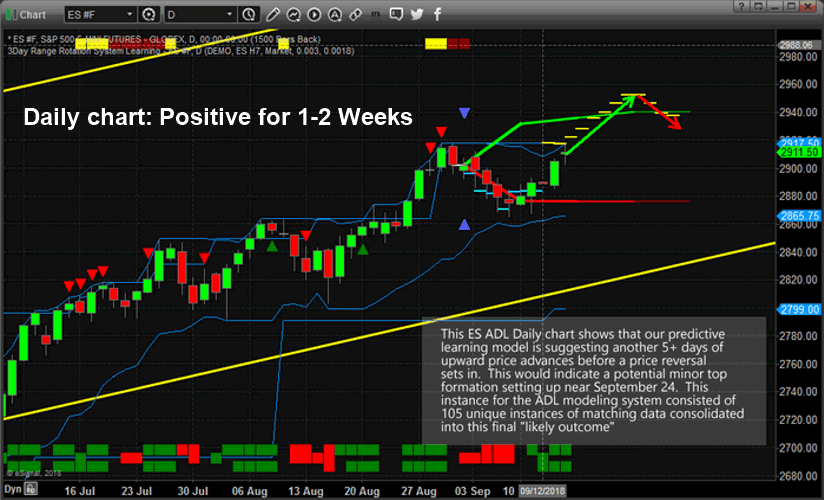
This first chart is a Daily ES chart showing our Adaptive Dynamic Learning (ADL) predictive price modeling tool. The YELLOW/CYAN dashed lines over the price bars and into the future show the highest probable outcome from the ADL predictive modeling analysis. This instance that predicts a 5~6 day price advance before a price peak sets up consisted of 105 unique instances of correlative price data making up this predictive analysis. In other words, 105 unique instances of similar predictive price patterns and predicts future price moves based on the highest likely outcome of all instances of data.
In this case, the ADL modeling system is suggesting we have about 4~6 more days of moderately higher price activity before a price top/peak will setup – prompting a new downward price trend.
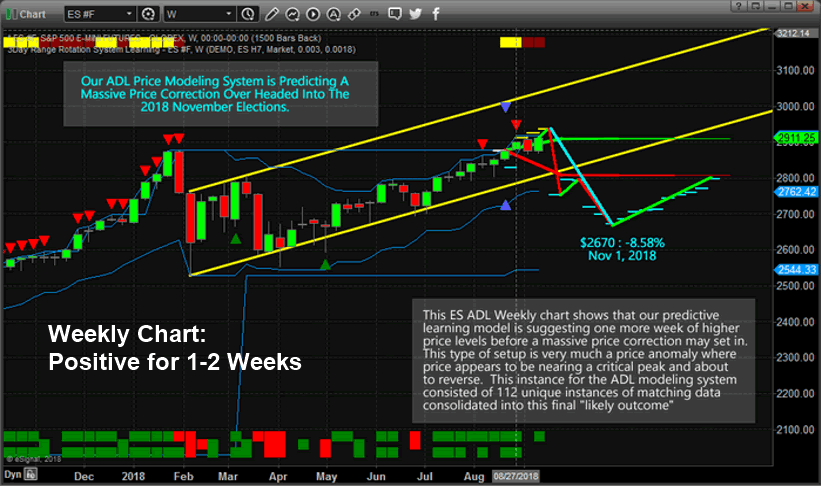
This ES Weekly ADL price chart correlates with the Daily chart almost perfectly. The Weekly chart predicts one additional week of upward price action before a massive 5~6% price decline drives prices lower. This massive price rotation executes over a 1 to 2-week span before briefly stalling, then an additional price decline of about 2% sets up driving prices to a predicted low near $2670 (-8.58%) on November 1, 2018 (just before the US elections).
This ADL analysis was generated by 112 unique instances of similar price data and the combined highest probability outcome is shown by the YELLOW and CYAN dashed lines on the chart. Simply put, we have a very high probability of a 5~8% price correction setting up over the next 20+ days in the US Equities markets with a projected bottom setting up near $2670.
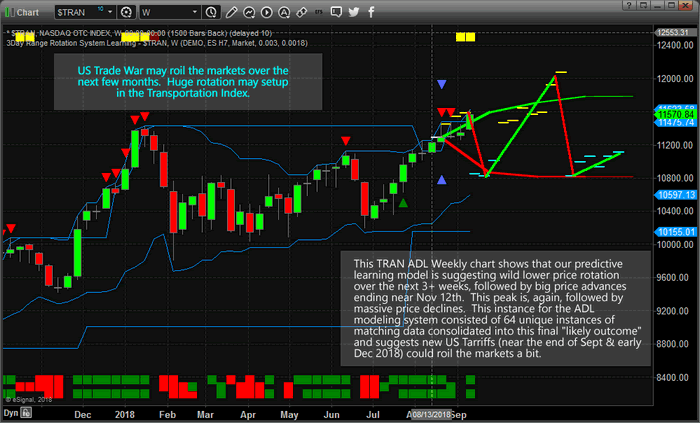
This last Weekly Transportation Index chart displaying the ADL predictive modeling system paints a very interesting picture when you combine it with the two earlier charts. The Transportation index typically leads the major markets by about 3 to 6 months. We have seen continued upside price advances in the Transportation Index over the past 6 months which leads us to think the US equities markets will continue to push higher overall. Yet, this Weekly ADL predictive modeling chart shows two massive price rotations are likely to unfold before the end of 2018. The first one is set up for a downside price rotation, ending near $10,800, starting the week of September 17, 2018, and lasting about 3~4 weeks. Then, the ADL predicts the Transportation Index will rocket higher, near $11,800, for about 5~6 weeks before falling again to retest the $10,800 lows near early December 2018.
We believe critical global news and expectations regarding global trade, banking and credit may become the catalysts for these moves. The US is expected to enact over $200 billion in trade tariffs this week with China. We believe the ADL predictive modeling system is capable of identifying these massive price rotations and predicting the future rotations simply because of the massive amounts of data that it is capable of crunching. This Weekly ADL prediction consisted of 112 unique price instances and displays only the highest probable outcome. In other words, our predictive modeling system is suggesting these price moves are likely to happen based on its analysis with a greater than 50% probability.
Please pay close attention to our research posts and other articles throughout the end of this year and early into 2019. As we have been attempting to warn our followers, expect increased volatility and wider price rotation throughout the end of this year.
We expect to find a number of incredible opportunities for our members over the next few months and we have already been incredibly successful throughout this recent price rally. Our ADL systems predicted this upside price move in February of 2018 and we have stuck with it. Now, the ADL is predicting a massive rotation is about to take place – somewhat similar to February 2018. If you want to learn how to profit from these moves, visit www.TheTechnicalTraders.com to learn how we help our members stay ahead of these types of market moves.
Chris Vermeulen
www.TheTechnicalTraders.com
Chris Vermeulen has been involved in the markets since 1997 and is the founder of Technical Traders Ltd. He is an internationally recognized technical analyst, trader, and is the author of the book: 7 Steps to Win With Logic
Through years of research, trading and helping individual traders around the world. He learned that many traders have great trading ideas, but they lack one thing, they struggle to execute trades in a systematic way for consistent results. Chris helps educate traders with a three-hour video course that can change your trading results for the better.
His mission is to help his clients boost their trading performance while reducing market exposure and portfolio volatility.
He is a regular speaker on HoweStreet.com, and the FinancialSurvivorNetwork radio shows. Chris was also featured on the cover of AmalgaTrader Magazine, and contributes articles to several leading financial hubs like MarketOracle.co.uk
Disclaimer: Nothing in this report should be construed as a solicitation to buy or sell any securities mentioned. Technical Traders Ltd., its owners and the author of this report are not registered broker-dealers or financial advisors. Before investing in any securities, you should consult with your financial advisor and a registered broker-dealer. Never make an investment based solely on what you read in an online or printed report, including this report, especially if the investment involves a small, thinly-traded company that isn’t well known. Technical Traders Ltd. and the author of this report has been paid by Cardiff Energy Corp. In addition, the author owns shares of Cardiff Energy Corp. and would also benefit from volume and price appreciation of its stock. The information provided here within should not be construed as a financial analysis but rather as an advertisement. The author’s views and opinions regarding the companies featured in reports are his own views and are based on information that he has researched independently and has received, which the author assumes to be reliable. Technical Traders Ltd. and the author of this report do not guarantee the accuracy, completeness, or usefulness of any content of this report, nor its fitness for any particular purpose. Lastly, the author does not guarantee that any of the companies mentioned in the reports will perform as expected, and any comparisons made to other companies may not be valid or come into effect.
Chris Vermeulen Archive |
© 2005-2022 http://www.MarketOracle.co.uk - The Market Oracle is a FREE Daily Financial Markets Analysis & Forecasting online publication.