


GBPUSD Set to Explode Higher
Currencies / British Pound Sep 17, 2018 - 09:42 AM GMTBy: Austin_Galt

 Pattern – we can see price bottomed out at 1.2662 and has subsequently made a pattern of higher highs and higher lows. The recent higher low formed a bullish double bottom, denoted by the horizontal line. Double bottoms which form just above the major low are generally an excellent indication of a new uptrend in play. I now expect price to do some backing and filling before launching higher again.
Daily Chart
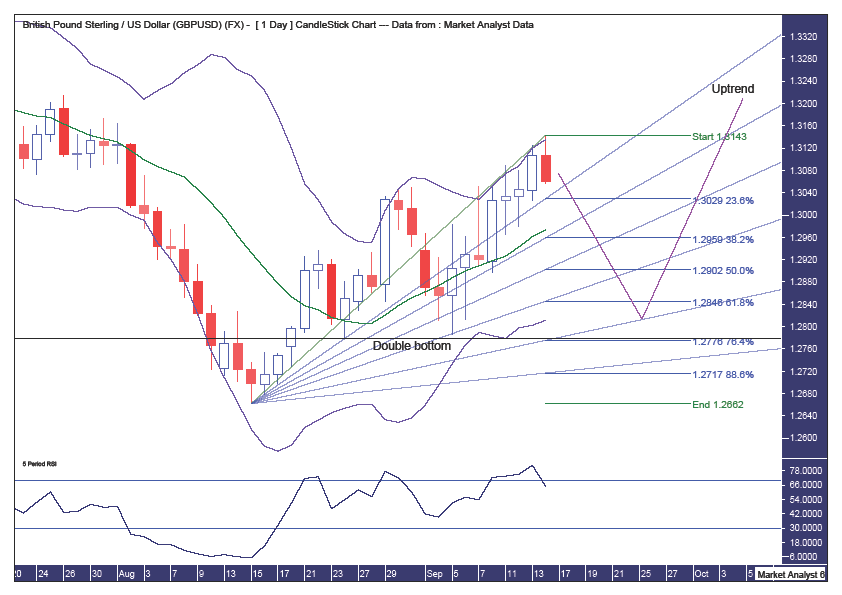
Bollinger Bands – price is at the upper band and I am looking for resistance to come in and send it back to the lower band for the next higher low.
Fibonacci – the double bottom was at retroactive support from the 76.4% retracement level so I believe we should now be looking at the next level of support being the 61.8% retracement level at 1.2846. And, as per usual, I like to see this level given a test so perhaps price can nudge marginally below before turning back up. The 76.4% angle looks a prime target.
RSI – strong.
Weekly Chart
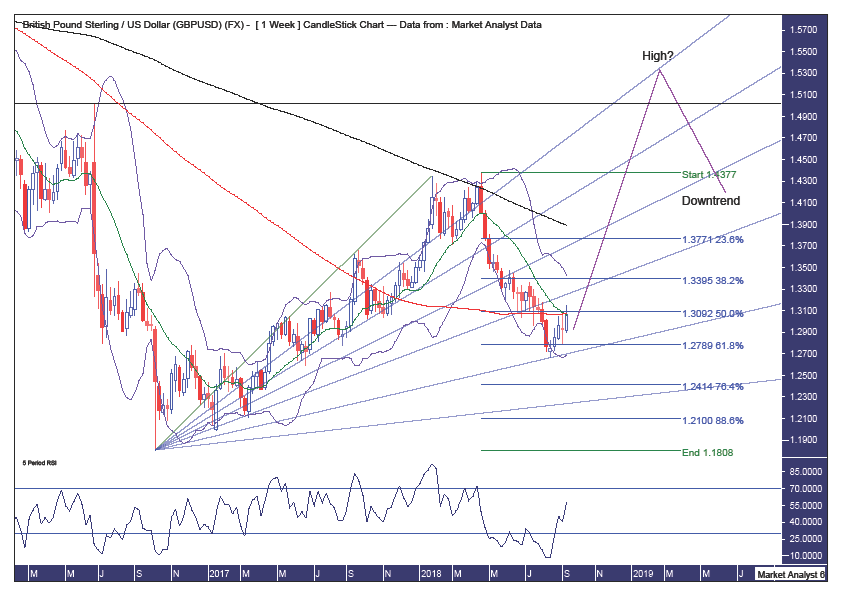
Pattern – the final leg of the bear rally that started in 2016 looks to have just commenced the final phase. This should be the most explosive leg.
Bollinger Bands – price is at the middle band and I expect some temporary resistance around here before heading north once again.
Fibonacci – this fan uses the first high as the end point and the low was bang on support from the 76.4% angle while clipping the 61.8% retracement level. Nice. I am now looking for price to surge higher and eventually top out at resistance from the 23.6% angle. If not, the 38.2% angle. Let’s see.
Horizontal line – denotes the price where price plunged after the Brexit vote and I expect price to trade back to that region.
Moving averages – in a bearish position which adds confidence that this is a bear rally only.
RSI – strong.
Summing up – after a small correction in the coming days, I expect price to surge higher and eventually top out above the 1.50 level.
By Austin Galt
Austin Galt has previously worked as a stockbroker and investment banker while studying technical analysis for over two decades. He is also the author of the book White Night: A Colombian Odyssey
Email - info@thevoodooanalyst.com
© 2018 Copyright The Voodoo Analyst - All Rights Reserved
Disclaimer: The above is a matter of opinion provided for general information purposes only and is not intended as investment advice. Information and analysis above are derived from sources and utilising methods believed to be reliable, but we cannot accept responsibility for any losses you may incur as a result of this analysis. Individuals should consult with their personal financial advisors.
Austin Galt Archive |
© 2005-2022 http://www.MarketOracle.co.uk - The Market Oracle is a FREE Daily Financial Markets Analysis & Forecasting online publication.