


Transportation Index Leads Stock Market Higher
Stock-Markets / Stock Markets 2018 Sep 11, 2018 - 07:58 AM GMTBy: Chris_Vermeulen

The recent upside breakout seen in the US Transportation Index is a very important signal for traders. Our research team has been following these moves for many months and we believe the recent upside breakout in the $TRAN is a strong sign of future US Equities price moves and all traders should be paying very close attention.
The Transportation Index typically leads the US Equities markets by about 3 to 6 months. Transportation is one of the core elements of economic activity. Items entering the US or distributed throughout the US must rely on transportation to ship/deliver these goods to resellers, wholesalers, and ports. When the Transportation Index rises, one should expect the economic activity to continue to increase.
Given that we are only three months from the Christmas holiday season and understanding that retailers, wholesalers, and warehouses have likely already been stocking up on the holiday items, it makes sense that the Transportation Index would have been climbing over the past few months. Remember, the Transportation Index leads equities by about 3 to 6 months. So, we would have expected the Transportation Index to rally about 6 months before December if the economy was strengthening.
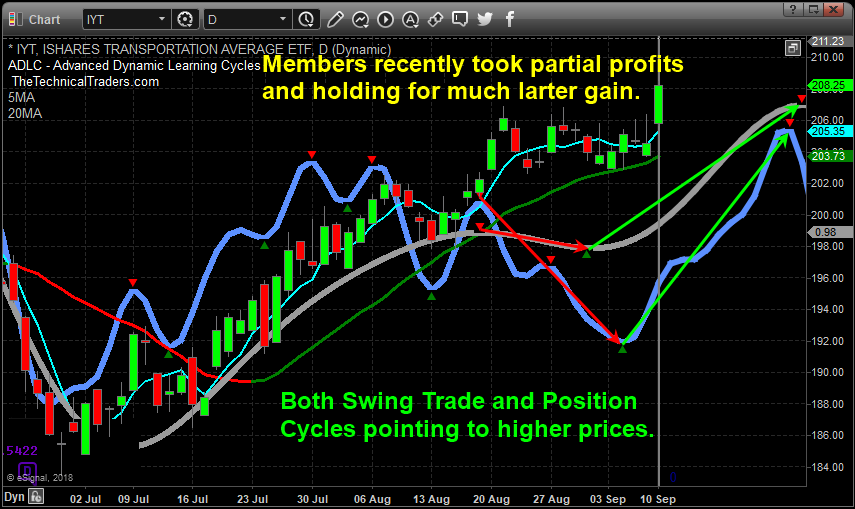
The breakout rally currently exhibited in the Transportation Index paints a picture that many may not be aware of for early 2019. Should the Transportation Index rally continue into October or November, or possibly longer, this would indicate that the US Equities market could continue to rally well into March or April of 2019 – possibly much longer. This means traders looking for a massive top any time soon, or big short sellers could have some big soling positions as this rally continues for the next 6+ months. While many are bearish on stocks and short the market, we remain long IYT with our position with members.
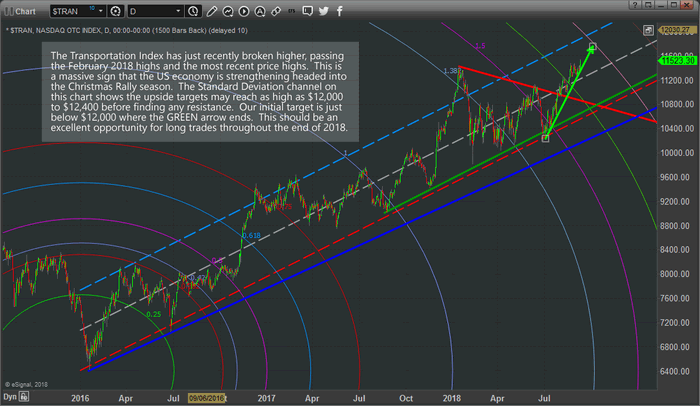
Let’s take a look at another chart. This Daily Transportation Index chart is very long term as we wanted to clearly illustrate the Standard Deviation channel that is in place going all the way back to 2016. The DASHED lines on the chart represent the Standard Deviation channel range that is likely to continue to operate as a price boundary going forward. The ARCs that appear on the chart are a unique tool we use to measure Fibonacci price acceleration and ranges. The upside price breakout points to an upside target of near $11,800 to $12,00 very quickly. From this level, we expect a bit of price rotation before another upside leg begins.
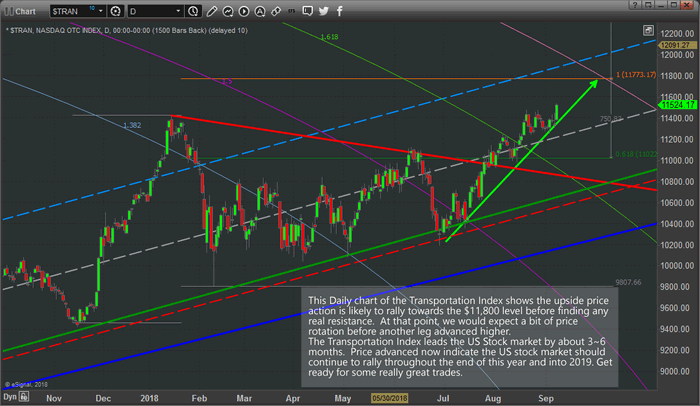
This next chart is the same Daily Transportation Index chart, just a closer view of the most recent 10+ months of price data. We can still see the Standard Deviation channel ranges and the upside breakout highlighted by our GREEN arrow. We’ve also added a Fibonacci price extension tool based on recent price rotation that points to an $11,773 upside target. We see confluence in multiple analysis techniques when multiple studies point to the same outcome. In this case, the Fibonacci Arcs, Fibonacci extensions and Standard Deviation channel all support the continued rally to near $11,800 for the Transportation Index.
As traders, this should be a very interesting and rewarding “look into the future” for many of you. These charts are suggesting the US Equities markets may continue to push much higher well into early 2019. As long as this upside trend in the Transportation Index continues, we should continue to expect a strengthening US economy, stronger economic and GDP levels and stronger consumer activities. In other words, get ready for some great long trades over the next few months and get ready to pick apart these opportunities as they play out.
Our team or researchers and professionals have been long the Transportation index for many weeks now. We identified this move months ago and alerted our followers to get into this trade early. If you want to know what our team of professional traders are telling our members now and how to find great opportunities throughout this move, visit www.TheTechnicalTraders.com to learn more.
Chris Vermeulen
www.TheTechnicalTraders.com
Chris Vermeulen has been involved in the markets since 1997 and is the founder of Technical Traders Ltd. He is an internationally recognized technical analyst, trader, and is the author of the book: 7 Steps to Win With Logic
Through years of research, trading and helping individual traders around the world. He learned that many traders have great trading ideas, but they lack one thing, they struggle to execute trades in a systematic way for consistent results. Chris helps educate traders with a three-hour video course that can change your trading results for the better.
His mission is to help his clients boost their trading performance while reducing market exposure and portfolio volatility.
He is a regular speaker on HoweStreet.com, and the FinancialSurvivorNetwork radio shows. Chris was also featured on the cover of AmalgaTrader Magazine, and contributes articles to several leading financial hubs like MarketOracle.co.uk
Disclaimer: Nothing in this report should be construed as a solicitation to buy or sell any securities mentioned. Technical Traders Ltd., its owners and the author of this report are not registered broker-dealers or financial advisors. Before investing in any securities, you should consult with your financial advisor and a registered broker-dealer. Never make an investment based solely on what you read in an online or printed report, including this report, especially if the investment involves a small, thinly-traded company that isn’t well known. Technical Traders Ltd. and the author of this report has been paid by Cardiff Energy Corp. In addition, the author owns shares of Cardiff Energy Corp. and would also benefit from volume and price appreciation of its stock. The information provided here within should not be construed as a financial analysis but rather as an advertisement. The author’s views and opinions regarding the companies featured in reports are his own views and are based on information that he has researched independently and has received, which the author assumes to be reliable. Technical Traders Ltd. and the author of this report do not guarantee the accuracy, completeness, or usefulness of any content of this report, nor its fitness for any particular purpose. Lastly, the author does not guarantee that any of the companies mentioned in the reports will perform as expected, and any comparisons made to other companies may not be valid or come into effect.
Chris Vermeulen Archive |
© 2005-2022 http://www.MarketOracle.co.uk - The Market Oracle is a FREE Daily Financial Markets Analysis & Forecasting online publication.