


Oil And Energies On The Move Lower
Commodities / Energy Resources Aug 13, 2018 - 07:16 AM GMTBy: Chris_Vermeulen

 If you have been following our analysis and research of the Crude Oil trend and the energy sector, you know we’ve been suggesting Crude would attempt a move lower and attempt to retest the $58~63 level. It appears the breakdown in prices has begun.
Our research team, at www.TheTechnicalTraders.com, uses an array of proprietary technology, price modeling tools and price cycle modeling tools to attempt to keep our followers up to date with trend reversals, trend expansions and more. This recent downside price move is something we have been expecting for the last 20+ days. The breakdown of support in the Crude oil market, as well as the oversupply of oil on the planet, is setting up for a downside move that could be extraordinary.
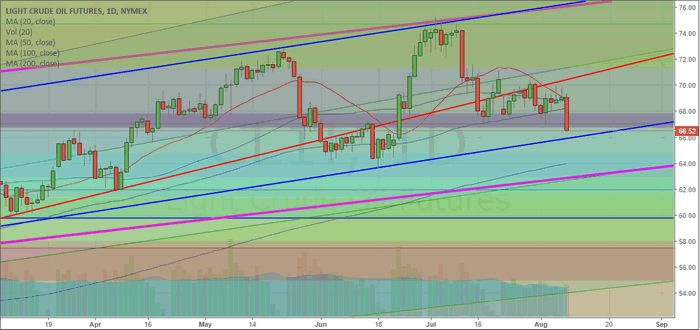
This Daily Crude Oil chart shows some of our trend following work where we attempt to identify break ranges, channels, Fibonacci levels and other advanced technical analysis studies. The daily chart only shows a shorter time span and is perfect for attempting to identify immediate support or resistance levels for the price. One can see from this chart that the current breakdown in price is attempting to breach a number of key Fibonacci levels. Should the $66.50 level be broken, we would expect Crude prices to fall to near $64.75 or $62.90. These are the next support levels below the current Fibonacci levels.
The Blue and Magenta levels on this chart are price channels that will become more evident on the next chart – the Weekly chart.
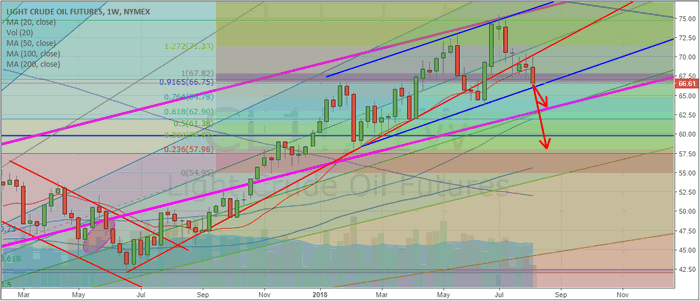
This Weekly Crude Oil chart provides a better, longer-term, perspective of the Oil market. We can see from this chart the Magenta price channel originates from 2016 price rotation. The Blue price channel originates from early 2018 price rotation. The lower, Red, support level originates from the low in June 2017. All of these play an important role in understanding how the price is breaking free of these price channels and may attempt to move dramatically lower.
We’ve already broken the Red support levels, are attempting to breach the Blue price channels and that only leaves the Magenta price channels as final support. Breaking all three of these levels would put Crude prices below $63.00 ppb and we believe that type of move could draw prices to below $60 ppb.
Pay close attention to the size of the most recent Weekly candles – they are much bigger in range than the late 2017 candle ranges. This indicates that volatility in the Crude Oil market is extended and any breakout/breakdown trend could be very aggressive in nature.
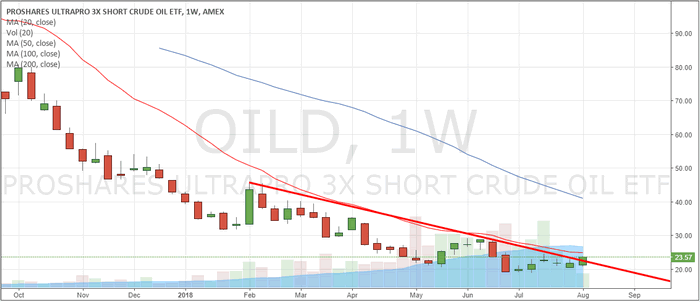
The last chart we have for you today is the OILD 3x Short Oil ETF. It is pretty easy to see that any downside price break in oil, with any longer-term capitulation, would likely drive the OILD prices from about $23.50 to possibly well above $27~32. This type of move could present an opportunity for a 20~40% ROI on a small position if Crude Oil breaks further to the downside. Any opportunity to buy OILD below $22.50 should be considered a strong potential setup as we believe Crude Oil will move to between $60~63 ppb before attempting to find any real support.
Follow our analysis and read all of our past research posts by visiting www.TheTechnicalTraders.com. Learn how we can help you stay ahead of these moves and find new opportunities in the markets. 53 years experience in researching and trading makes analyzing the complex and ever-changing financial markets a natural process. We have a simple and highly effective way to provide our customers with the most convenient, accurate, and timely market forecasts available today. Our stock and ETF trading alerts are readily available through our exclusive membership service via email and SMS text. Our newsletter, Technical Trading Mastery book, and 3 Hour Trading Video Course are designed for both traders and investors. Also, some of our strategies have been fully automated for the ultimate trading experience.
Chris Vermeulen
www.TheTechnicalTraders.com
Chris Vermeulen has been involved in the markets since 1997 and is the founder of Technical Traders Ltd. He is an internationally recognized technical analyst, trader, and is the author of the book: 7 Steps to Win With Logic
Through years of research, trading and helping individual traders around the world. He learned that many traders have great trading ideas, but they lack one thing, they struggle to execute trades in a systematic way for consistent results. Chris helps educate traders with a three-hour video course that can change your trading results for the better.
His mission is to help his clients boost their trading performance while reducing market exposure and portfolio volatility.
He is a regular speaker on HoweStreet.com, and the FinancialSurvivorNetwork radio shows. Chris was also featured on the cover of AmalgaTrader Magazine, and contributes articles to several leading financial hubs like MarketOracle.co.uk
Disclaimer: Nothing in this report should be construed as a solicitation to buy or sell any securities mentioned. Technical Traders Ltd., its owners and the author of this report are not registered broker-dealers or financial advisors. Before investing in any securities, you should consult with your financial advisor and a registered broker-dealer. Never make an investment based solely on what you read in an online or printed report, including this report, especially if the investment involves a small, thinly-traded company that isn’t well known. Technical Traders Ltd. and the author of this report has been paid by Cardiff Energy Corp. In addition, the author owns shares of Cardiff Energy Corp. and would also benefit from volume and price appreciation of its stock. The information provided here within should not be construed as a financial analysis but rather as an advertisement. The author’s views and opinions regarding the companies featured in reports are his own views and are based on information that he has researched independently and has received, which the author assumes to be reliable. Technical Traders Ltd. and the author of this report do not guarantee the accuracy, completeness, or usefulness of any content of this report, nor its fitness for any particular purpose. Lastly, the author does not guarantee that any of the companies mentioned in the reports will perform as expected, and any comparisons made to other companies may not be valid or come into effect.
Chris Vermeulen Archive |
© 2005-2022 http://www.MarketOracle.co.uk - The Market Oracle is a FREE Daily Financial Markets Analysis & Forecasting online publication.