


Crude Oil – Precious Metals Link and Its Implications
Commodities / Crude Oil Jul 03, 2018 - 12:42 PM GMTBy: Nadia_Simmons

 In recent days, oil bulls have accustomed us to fresh peaks. However, when we look more closely at the volume, their actions lose some of the glow. When we add the picture, which emerges from the relationship between crude oil and precious metals, doubts about the strength of the rally are getting even bigger. Is it possible that this interesting link tells us more about the future of black gold?
Let’s take a closer look at the charts below (charts courtesy of http://stockcharts.com).
Technical Picture of Crude Oil
Today, we’ll start this section with the long-term picture of black gold.
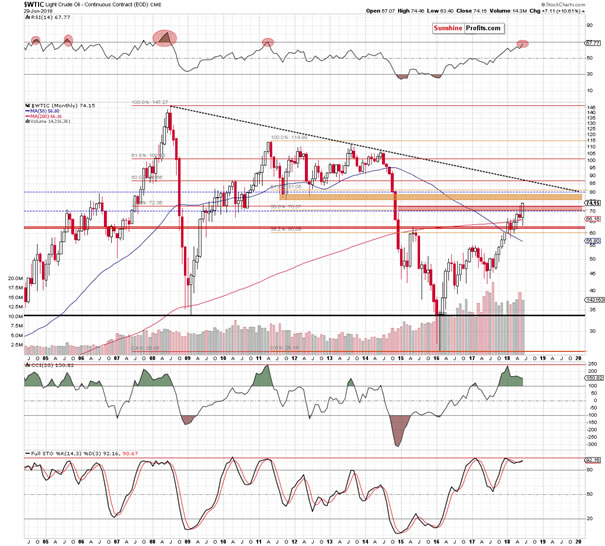
The first thing that catches the eye is the breakout above the red resistance zone created by two important Fibonacci retracements. Such price action is a bullish signal, which suggests further improvement.
Nevertheless, in our opinion, there are several factors that spoil this positive image.
First, even if black gold increases once again from current levels, we should keep in mind that the road to higher levels is not as wide open as it might seem at first glance. Why? Because at the level of $75.71 another resistance zone begins - this time created by the August 2011, October 2011 and June 2012 lows.
At this point, oil bulls will probably protest, saying that it is only the lower line of the resistance area and with their earlier strength they will be able to push the price of the commodity even to the barrier of $80, which is slightly above the mentioned zone.
We would probably agree with them if we could see their strength in size of volume as well. Unfortunately, in this regard the buyers have nothing to brag about, because last month's strong growth materialized on a much weaker volume than May's decline. In addition, if we compare the June and April volumes, we do not find any reasons to be delighted either.
And speaking about the volume… similar situation we can also observe in the short-term perspective, where the discrepancy between the rising price of light crude and the falling volume is even bigger.
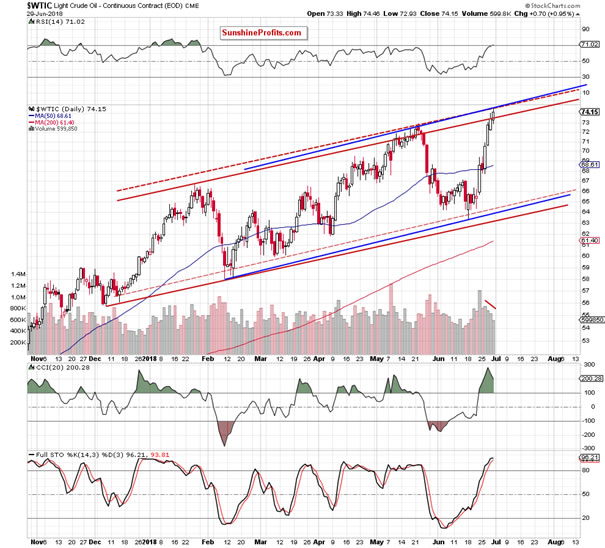
From today’s point of view, we see that although black gold went higher on Friday,the commodity remains inside both rising trend channels: the blue one (based on the February and June lows and the May high) and the red one (created by the support line based on the December 2017 and February 2018 lows and the resistance line based on the January peak.
At this point, it is worth noting that although black gold climbed above the upper border of the red rising trend channel in May, oil bulls didn’t manage to push the price higher, which resulted in a reversal and encouraged their opponent to act. Thanks to their action light crude approached the lower border of the channel.
Taking this fact into account and combining it with the current position of the daily indicators (they climbed to the highest levels since late May), it seems that even if light crude moves a bit higher from here, the upper border of the blue rising trend channel will be able to stop further rally in the coming day(s).
This scenario is also supported by the volume, which drops from session to session, raising more and more doubts about the strength of the bulls. On top of that, the picture, which emerges from the relationship between crude oil and precious metals also doesn’t bode well for further rally.
Crude Oil – Precious Metals Link
Let’s start this section with the long-term picture of the oil-to-gold ratio.
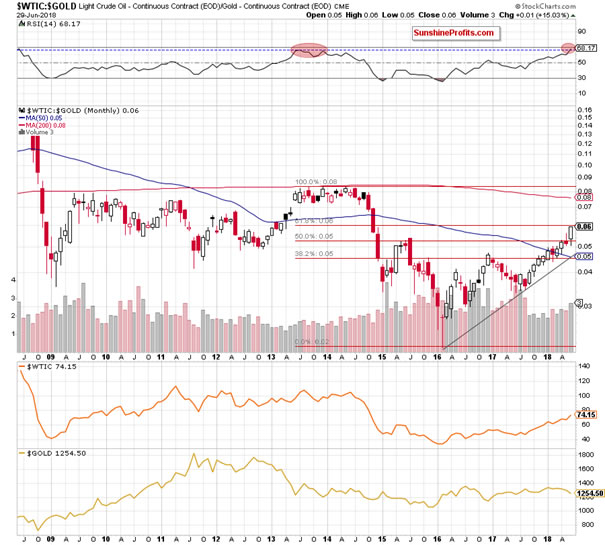
As you see on the above chart, the ratio approached the 61.8% Fibonacci retracement
based on the entire 2013-2016 downward move, which suggests that even if the ratio moves slightly higher, the space for gains may be limited by this important resistance in the very near future.
Additionally, the RSI climbed to its highest level since 2013. Did anything important happen then?Looking at the above chart, we can see that such high reading of the indicator(we marked it with the red ellipse) preceded a multi-month consolidation and, in fact, a strong downward move that allowed our readers to increase their profits.
So, will the history repeat itself once again? At the first glance, this is a fairly credible scenario, but let's check other charts to have a fuller picture of the current situation.
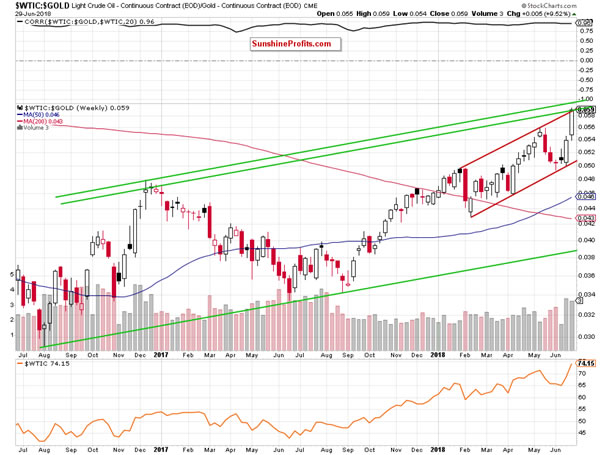
Considering the same ratio, but from the medium-term perspective, we see it climbed to the resistance area created by two important resistance lines: the upper line of the red rising trend channel and the upper border of the long-term green rising trend channel.
In the above case, the ratio also has some space for growth (to the upper green line, which is based on an intraweek high), but it seems very limited. At this point, you can ask: ok, but what does this have to do with the price of crude oil? As it turned out many times in the past, it has quite a lot in common. Why? As you can see on the above chart, the level of correlation between the price of light crude and the ratio is very high (0.96), which means that the potential reversal in the case of ratio can also translate into a reversal in the case of black gold – just like it has already happened many times in similar cases. Therefore, in our opinion, careful observation of this chart may give us an advantage and confirm the potential moment of opening the position.
Can we infer something more from the daily chart?
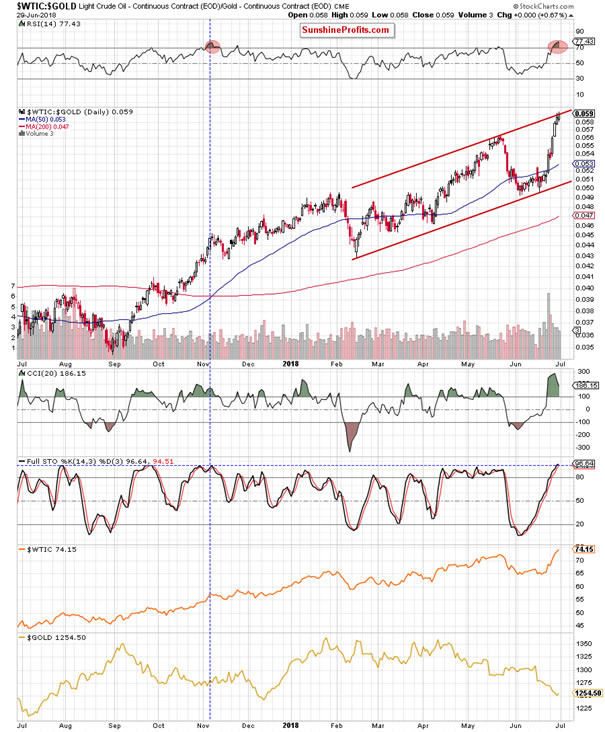
From this point of view, you can see more clearly the red rising trend channel and the level of the RSI. Similar reading of the indicator we saw only once during last year. Back then, it preceded a correction, which took place in the following days, which suggests that we may see something similar in the coming week.
Having said that, let’s focus on the relationship between crude oil and silver.
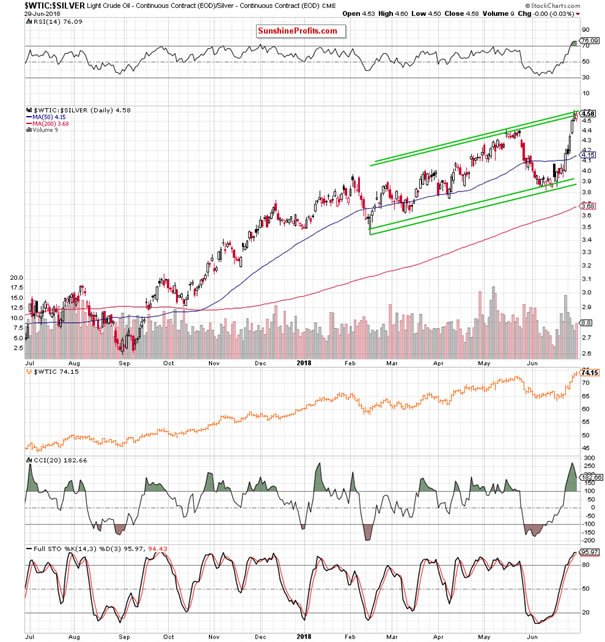
In this case, we can also see that the ratio moved to the resistance area created by the upper lines of the green rising trend channels (in terms of an intraday highs/lows and daily opening/closures) and the RSI increased to its higher level since July 2017, which increases the probability of reversal in the very near future – especially if we see one more day with declining volume.
Summing up, crude oil moved higher once again and broke above the red resistance zone seen on the long-term chart. Although this is a bullish sign, all other resistances continue to keep gains in check, which in combination with decreasing volume suggests that reversal is just around the corner.
If you enjoyed the above analysis and would like to receive free follow-ups, we encourage you to sign up for our daily newsletter – it’s free and if you don’t like it, you can unsubscribe with just 2 clicks. If you sign up today, you’ll also get 7 days of free access to our premium daily Oil Trading Alerts as well as Gold & Silver Trading Alerts. Sign up now.
Nadia Simmons
Forex & Oil Trading Strategist
Przemyslaw Radomski
Founder, Editor-in-chief
Sunshine Profits: Gold & Silver, Forex, Bitcoin, Crude Oil & Stocks
Stay updated: sign up for our free mailing list today
* * * * *
Disclaimer
All essays, research and information found above represent analyses and opinions of Nadia Simmons and Sunshine Profits' associates only. As such, it may prove wrong and be a subject to change without notice. Opinions and analyses were based on data available to authors of respective essays at the time of writing. Although the information provided above is based on careful research and sources that are believed to be accurate, Nadia Simmons and his associates do not guarantee the accuracy or thoroughness of the data or information reported. The opinions published above are neither an offer nor a recommendation to purchase or sell any securities. Nadia Simmons is not a Registered Securities Advisor. By reading Nadia Simmons’ reports you fully agree that he will not be held responsible or liable for any decisions you make regarding any information provided in these reports. Investing, trading and speculation in any financial markets may involve high risk of loss. Nadia Simmons, Sunshine Profits' employees and affiliates as well as members of their families may have a short or long position in any securities, including those mentioned in any of the reports or essays, and may make additional purchases and/or sales of those securities without notice.
© 2005-2022 http://www.MarketOracle.co.uk - The Market Oracle is a FREE Daily Financial Markets Analysis & Forecasting online publication.