Most Popular
1. Banking Crisis is Stocks Bull Market Buying Opportunity - Nadeem_Walayat
2.The Crypto Signal for the Precious Metals Market - P_Radomski_CFA
3. One Possible Outcome to a New World Order - Raymond_Matison
4.Nvidia Blow Off Top - Flying High like the Phoenix too Close to the Sun - Nadeem_Walayat
5. Apple AAPL Stock Trend and Earnings Analysis - Nadeem_Walayat
6.AI, Stocks, and Gold Stocks – Connected After All - P_Radomski_CFA
7.Stock Market CHEAT SHEET - - Nadeem_Walayat
8.US Debt Ceiling Crisis Smoke and Mirrors Circus - Nadeem_Walayat
9.Silver Price May Explode - Avi_Gilburt
10.More US Banks Could Collapse -- A Lot More- EWI
Last 7 days
Stock Market Volatility (VIX) - 25th Mar 24
Stock Market Investor Sentiment - 25th Mar 24
The Federal Reserve Didn't Do Anything But It Had Plenty to Say - 25th Mar 24
Stock Market Breadth - 24th Mar 24
Stock Market Margin Debt Indicator - 24th Mar 24
It’s Easy to Scream Stocks Bubble! - 24th Mar 24
Stocks: What to Make of All This Insider Selling- 24th Mar 24
Money Supply Continues To Fall, Economy Worsens – Investors Don’t Care - 24th Mar 24
Get an Edge in the Crypto Market with Order Flow - 24th Mar 24
US Presidential Election Cycle and Recessions - 18th Mar 24
US Recession Already Happened in 2022! - 18th Mar 24
AI can now remember everything you say - 18th Mar 24
Bitcoin Crypto Mania 2024 - MicroStrategy MSTR Blow off Top! - 14th Mar 24
Bitcoin Gravy Train Trend Forecast 2024 - 11th Mar 24
Gold and the Long-Term Inflation Cycle - 11th Mar 24
Fed’s Next Intertest Rate Move might not align with popular consensus - 11th Mar 24
Two Reasons The Fed Manipulates Interest Rates - 11th Mar 24
US Dollar Trend 2024 - 9th Mar 2024
The Bond Trade and Interest Rates - 9th Mar 2024
Investors Don’t Believe the Gold Rally, Still Prefer General Stocks - 9th Mar 2024
Paper Gold Vs. Real Gold: It's Important to Know the Difference - 9th Mar 2024
Stocks: What This "Record Extreme" Indicator May Be Signaling - 9th Mar 2024
My 3 Favorite Trade Setups - Elliott Wave Course - 9th Mar 2024
Bitcoin Crypto Bubble Mania! - 4th Mar 2024
US Interest Rates - When WIll the Fed Pivot - 1st Mar 2024
S&P Stock Market Real Earnings Yield - 29th Feb 2024
US Unemployment is a Fake Statistic - 29th Feb 2024
U.S. financial market’s “Weimar phase” impact to your fiat and digital assets - 29th Feb 2024
What a Breakdown in Silver Mining Stocks! What an Opportunity! - 29th Feb 2024
Why AI will Soon become SA - Synthetic Intelligence - The Machine Learning Megatrend - 29th Feb 2024
Keep Calm and Carry on Buying Quantum AI Tech Stocks - 19th Feb 24

Market Oracle FREE Newsletter

How to Protect your Wealth by Investing in AI Tech Stocks

Orange Juice Commodity Trading Analysis

Commodities / Commodities Trading Jun 18, 2018 - 02:03 PM GMT

By: Austin_Galt

Commodities

Latest Price – $159.90. Previous analysis updated – price has traded exactly as outlined, rallying before finding resistance and I now believe the next leg up has commenced.


Daily Chart

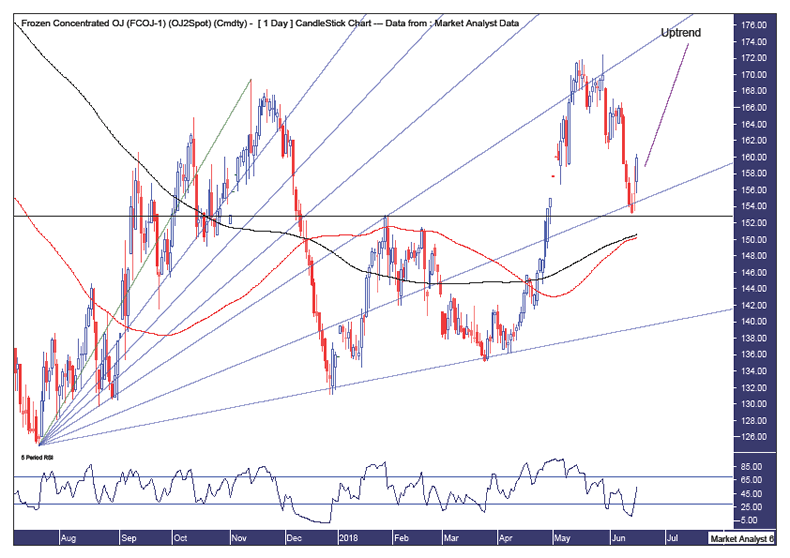
Pattern – an uptrend is clearly in play with price breaking the previous swing high before correcting. Price appears to have just put in another low with the next keg up now underway.

Fibonacci – the 88.6% angle provided solid support and saw price leap up to the 61.8% angle where resistance came in. A move back to the 76.4% angle saw the next level of support kick in and price should now get back up to the 61.8% as it continues to trade higher.

Horizontal line – denotes the first high in this new uptrend and as previous highs often provide support in the future, so too did this high with the recent low coming in at this level of support.

Moving averages – still in a bearish position but they have come together and I believe a bullish crossover is imminent.

RSI – just moved into strong territory.

Monthly Chart

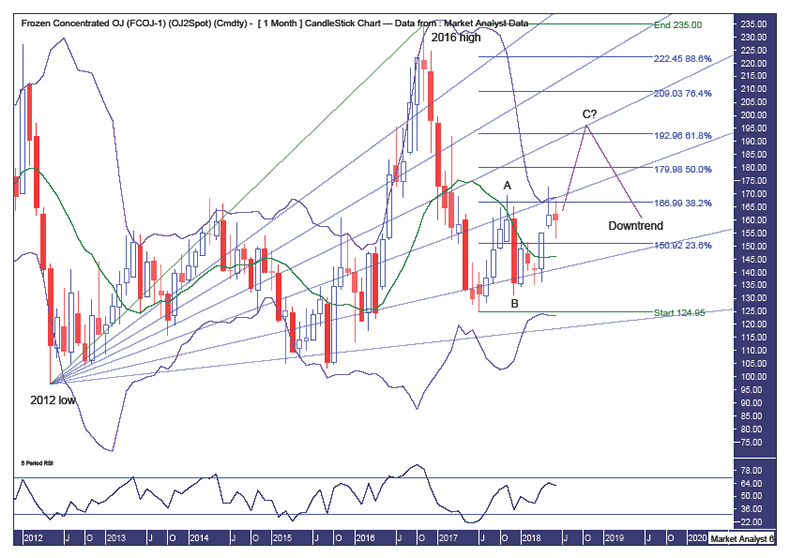
Pattern – I believe an ABC correction is in play with points A and B already in place with price tracing its way to a wave C high.

Bollinger Bands – price found initial resistance at the upper band but I doubt it will get back down to the middle band. Instead, I favour price to continue higher as it pushes higher into this upper band

Fibonacci – price has found resistance at the 61.8% angle but I expect this to be temporary only as price pushes higher and up to the next area of resistance from the 50% angle. I am targeting price to clip the 61.8% retracement level of the move down from the 2016 high. This level stands at $192.96.

RSI – looking strong.

Summing up – the current uptrend is looking solid and I expect it to continue higher over the coming months.

By Austin Galt

www.thevoodooanalyst.com 

Austin Galt has previously worked as a stockbroker and investment banker while studying technical analysis for over two decades. He is also the author of the book White Night: A Colombian Odyssey

Email - info@thevoodooanalyst.com 

My website is www.thevoodooanalyst.com 

© 2018 Copyright  The Voodoo Analyst - All Rights Reserved

Disclaimer: The above is a matter of opinion provided for general information purposes only and is not intended as investment advice. Information and analysis above are derived from sources and utilising methods believed to be reliable, but we cannot accept responsibility for any losses you may incur as a result of this analysis. Individuals should consult with their personal financial advisors.

Austin Galt Archive

© 2005-2022 http://www.MarketOracle.co.uk - The Market Oracle is a FREE Daily Financial Markets Analysis & Forecasting online publication.


Post Comment

Only logged in users are allowed to post comments. Register/ Log in