


Crude Oil Price Targeting $58 ppb Before Finding Support
Commodities / Crude Oil Jun 14, 2018 - 05:30 AM GMTBy: Chris_Vermeulen

 With the G7 meeting concluding and the world about to start reacting to what was said and what was heard, it is time to take a look at the Crude charts with our Advanced Fibonacci price modeling system.
Our research team, at www.TheTechnicalTraders.com, believes Crude will continue to drift lower over the next few weeks testing the $60 ppb level before breaching this support level and ultimately targeting $58 or lower. Lacking a real resolution to the trade and other global issues, we believe continue global economic pressures will drive oil prices dramatically lower over time – at least through the Summer months.
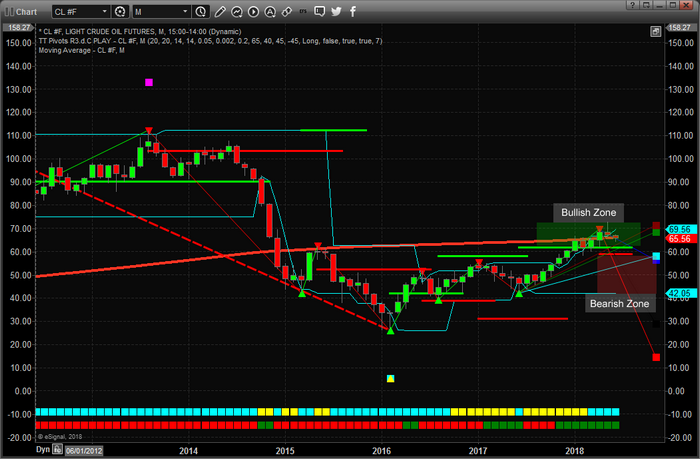
This Monthly Crude Light chart shows our Advanced Fibonacci price modeling system at work. As of right now, we see a recent price rotation top (highlighted by the RED DOWN TRIANGLE) near the right edge of price as well as the RED and GREEN Fibonacci projection levels near $69.50. These projection levels indicate that the $69.50 level is likely resistance. Notice the BLUE and CYAN Fibonacci projection levels near $58.00 ppb. The fact that these two levels nearly overlap one another indicates that the $58.00 ppb level is a key price level for current support. Obviously, the ultimate downside target, near $14.00 ppb, is an extended downside level that could happen – but is not likely till all other levels a breached with downside price activity.
Currently, as long as the $60.00 ppb is not breached, the Monthly Fibonacci price modeling system trend is “Bullish” and a move to below $58.00 would change the trend to “Bearish”. As we stated, the $60.00 price level is critical going forward on this Monthly chart.
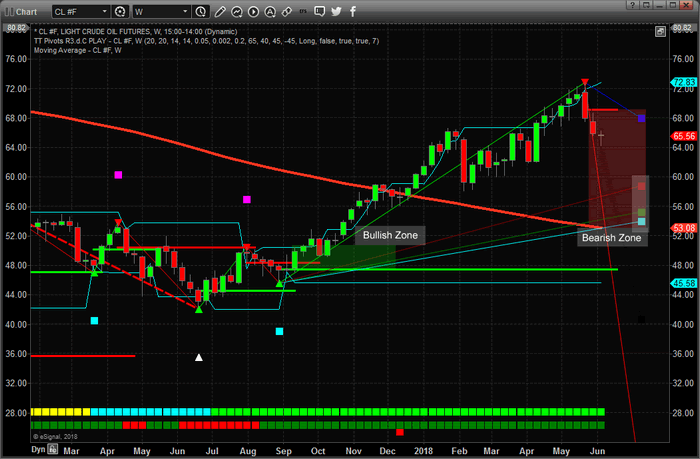
This Weekly Crude Light chart paints a shorter-term price picture and clearly highlights the most recent price decline with a clear sell trigger near $69.00. Take special notice of the Fibonacci upside targets between $54 an $58 near the right side of the chart. These upside targets, because the price is moving lower from above and has breached the Bearish Price Trigger Level (RED), are now downside target levels. With no real support between the current price and the $58.00 level, we expect oil to continue to fall to near the $58.00 level before finding some support – possibly as low as $54.00. Ultimately, if these levels don’t provide sufficient price support, oil prices could fall back to near $45 ppb before finding any real support – a -30% decrease from current price levels.
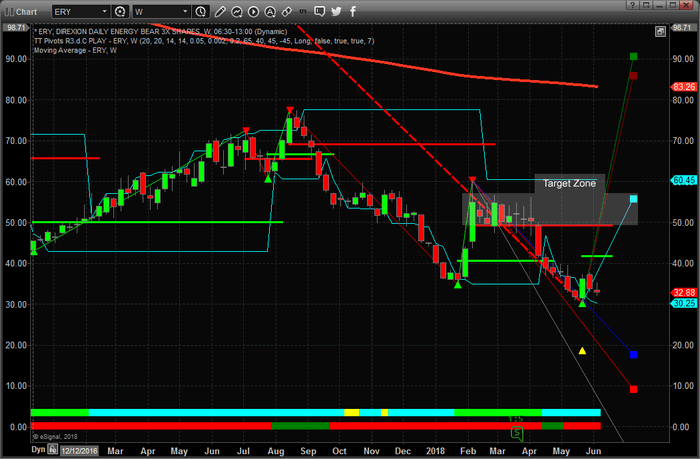
One thing that we find interesting is that the ERY (Energy Bear ETF) has yet to reflect any of this concern. Yes, we can see some price support near the right edge of this Weekly ERY chart, yet it appears the general market is not factoring in the gap in support below the $58.00 price level – meaning ERY could see a big jump higher on any price breakdown in Crude prices. How big? Our research team believes this move could be greater than 70% ROI from current levels if our predictions are correct. A breakdown from current levels to below $55.00 ppb in Crude would likely cause ERY to rocket above $60.00 per share from the current price levels near $32.50.
To be clear, Crude is poised to retest the $60.00 ppb level before attempting to find support near $58.00. If this support fails, then expect Crude to fall to near $54.00 ppb before finding support. This move will likely cause ERY to rocket upward to well above $50.00 on a short-term move (possibly higher).
Watch for news this week regarding oil supplies and the G7 aftermath. We are certain the news cycles will provide some hints as to the future economic cycles and expectations for the Summer months. We believe the supply glut and current trade issues are causing concerns in trade and transportation activities, thus we believe the downside move in Oil is almost inevitable at the moment. Great supply, diminishing demand, and global trade/economic concerns will likely push Oil prices back below $55 within the next 30~45 days.
Stay aware of these fantastic trade opportunities by visiting www.TheTechnicalTraders.com and learn how we can help you stay ahead of the markets with our advanced predictive modeling systems, expert research, daily video content and detailed trading signals. Our proprietary research is second to none – you won’t find these tools or capabilities anywhere else. Visit our Wealth Building Newsletter today to learn how we’ve called nearly every move in the markets this year and continue to astound our members with our detailed research. Opportunities exist for profits every month – it is simply a matter of finding them (that’s what we do) and you just execute the trade setups.
Join the Wealth Building Newsletter Now
and Know What Will Happen Tomorrow!
Chris Vermeulen
www.TheTechnicalTraders.com
Chris Vermeulen has been involved in the markets since 1997 and is the founder of Technical Traders Ltd. He is an internationally recognized technical analyst, trader, and is the author of the book: 7 Steps to Win With Logic
Through years of research, trading and helping individual traders around the world. He learned that many traders have great trading ideas, but they lack one thing, they struggle to execute trades in a systematic way for consistent results. Chris helps educate traders with a three-hour video course that can change your trading results for the better.
His mission is to help his clients boost their trading performance while reducing market exposure and portfolio volatility.
He is a regular speaker on HoweStreet.com, and the FinancialSurvivorNetwork radio shows. Chris was also featured on the cover of AmalgaTrader Magazine, and contributes articles to several leading financial hubs like MarketOracle.co.uk
Disclaimer: Nothing in this report should be construed as a solicitation to buy or sell any securities mentioned. Technical Traders Ltd., its owners and the author of this report are not registered broker-dealers or financial advisors. Before investing in any securities, you should consult with your financial advisor and a registered broker-dealer. Never make an investment based solely on what you read in an online or printed report, including this report, especially if the investment involves a small, thinly-traded company that isn’t well known. Technical Traders Ltd. and the author of this report has been paid by Cardiff Energy Corp. In addition, the author owns shares of Cardiff Energy Corp. and would also benefit from volume and price appreciation of its stock. The information provided here within should not be construed as a financial analysis but rather as an advertisement. The author’s views and opinions regarding the companies featured in reports are his own views and are based on information that he has researched independently and has received, which the author assumes to be reliable. Technical Traders Ltd. and the author of this report do not guarantee the accuracy, completeness, or usefulness of any content of this report, nor its fitness for any particular purpose. Lastly, the author does not guarantee that any of the companies mentioned in the reports will perform as expected, and any comparisons made to other companies may not be valid or come into effect.
Chris Vermeulen Archive |
© 2005-2022 http://www.MarketOracle.co.uk - The Market Oracle is a FREE Daily Financial Markets Analysis & Forecasting online publication.