


Stock Market Eying Extension Into March Highs
Stock-Markets / Stock Markets 2018 Jun 12, 2018 - 11:49 AM GMTBy: Submissions

 High Odds that Low of Year Confirmed
The first week of June was fairly easy to navigate and trade as the bullish pattern took a couple extra weeks of high level consolidation to finally complete its course. It really started with the breakout on Monday June 4 above the key 2742 level to confirm that the bull train is ready for the immediate breakout to accelerate above the prior two weeks’ worth of consolidation range (2742 vs.2700/2675). On the next day, the bull train grinded up a little and held above the 2742 breakout level to trap in more market participants for the high odds of a trend week.
During Wednesday’s session, the bull train finally entered its true acceleration phase towards the 2780 measured move target derived from about three weeks ago. Once the train got past the 2755 trigger, it was almost guaranteed going to BTFD for the rest of the week as bears had little to no chances left.
The bulls managed to fulfill the 2780 target during the Thursday early European market hours and once again hit against the level at the RTH open. The market then stalled against this temporary ceiling and backtested versus the 2760-2655 trending support region to take a breather first before wrapping up the week at the dead highs for the icing on the cake part.
The main takeaway from last week was similar to the prior week as Friday managed to close at a quite strong level and shows commitment. Also, obviously the 2780 measured move target finally being fulfilled is a big clue for further extensions to the upside given the bull train momentum.
What’s Next?
Friday closed at 2782.75 (all levels discussed are based on the ES September contract) and the bulls got their icing on the cake moment for the weekly closing candle. It’s fairly impressive for momentum purposes and they completed their very bullish setup from the past 3 weeks worth of high level consolidation.
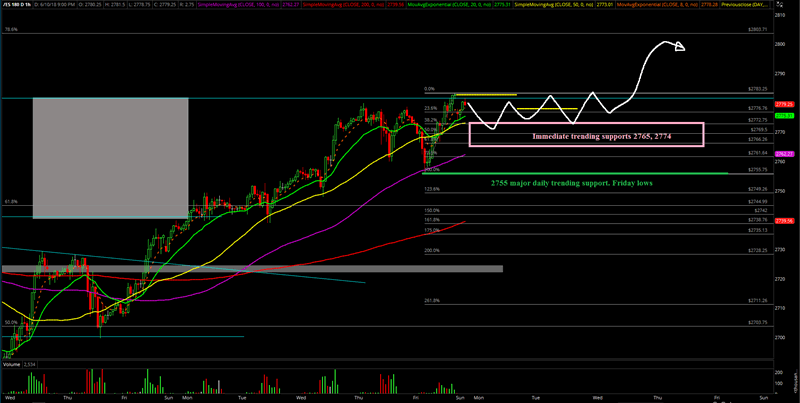
Heading into this week, we’re looking for the bull train to extend towards the new 2800~ target, which is the March highs region and also a major level that indicates a good old 100-point round number. In which case, we’re also expecting the bull train to stall against such a major level if so given the historical tendencies. (if not, then you know what’s up, bulls still too strong and bears missing in action)
The immediate trending supports have moved up once again into 2765 and 2774 where price remains in an uber bullish mode when above these levels for potential immediate follow through. Zooming out, there’s no damage done on the daily chart unless price gets below 2755, which is Friday’s low (from the overnight hours backtest vs support).
For now, we have switched into a 1-hr white line projection chart heading into this week, starting off with a tight consolidation, then accelerating towards 2800~ when it’s ready. It remains valid when above immediate trending support levels or we adjust in real-time. (4hr chart is too hard to draw this weekend as price is clumped at the highs and supports). Either way, the main point to understand is that when above support levels, treat as a bull train continuation week similar to last week's upside trading bias.
Macro Perspective
Zooming out to the macro pattern along with weekly/monthly timeframe charts, we now see fairly high odds percentage that the low of the year has been confirmed. We kept discussing about this potential scenario as early as some of the March KISS reports that we’ve highlighted and beyond. At this point, we pretty much consider it as much a high probability scenario while we did our homework by scanning across the indices, stocks and certain sectors. The market so far has had spent 3.5 months digesting the huge February monthly range (2837.25 vs 2529) and it’s getting to the point where the eventual digestion/consolidation would result in a bullish higher highs breakout. We think traders ought to keep zooming out and look for some potentially great risk vs. reward setups in high beta stocks, sectors or whatever instrument that fits within this macro perspective. There’s still a lot of potential and time left for the year of 2018. The previous derived measured move target levels include 2948.5, 3191, 3270.75, 3602.25 so it’s something to think about for those that have a larger timeframe horizon along with following us navigating the short-term picture. Context is key after all and it could help make you a better trader.
Here’s a snippet below from the March 11 weekend report that we could quickly find for additional context:
Bigger picture wise, we’re getting more and more inclined that the low of this year is in already with the 2529 low and those macro levels of 2948.5, 3191, 3270.75, 3602.25 may need to be discussed once again in more details for a faster ride potential. We’ll probably get a better idea on the macro perspective by end of this week or month. Technically, it’s still an inside month and we’re still expected at least another month to digest in this zone as discussed numerous times over the past few weeks unless bulls transition this into straight up acceleration phase again. For current times, repeat: We have the exact same plan for the entire month given the market dynamics: we think traders need to really stay nimble for March given this huge monthly range. At least this is how we’re going to switch up the plan for trading the brand new month based on the current situation.
See expandable charts on the Emini S&P 500.
Ricky Wen is an analyst at ElliottWaveTrader.net, where he hosts the ES Trade Alerts premium subscription service.
© 2018 Copyright Ryan Wilday - All Rights Reserved Disclaimer: The above is a matter of opinion provided for general information purposes only and is not intended as investment advice. Information and analysis above are derived from sources and utilising methods believed to be reliable, but we cannot accept responsibility for any losses you may incur as a result of this analysis. Individuals should consult with their personal financial advisors
© 2005-2022 http://www.MarketOracle.co.uk - The Market Oracle is a FREE Daily Financial Markets Analysis & Forecasting online publication.