


Crude Oil Bullish Weekly Reversal vs. Bearish Monthly Reversal
Commodities / Crude Oil Jun 08, 2018 - 04:34 PM GMTBy: Nadia_Simmons

 Crude oil moved significantly lower after topping at long-term retracement levels and since the monthly decline took place on big volume (biggest in almost a year), the black gold should move lower. But instead of moving lower this week, it seems to be forming a weekly bullish reversal. The individual daily volume levels were not low this week, so if the bullish reversal does indeed form, we’ll have a quite reliable bullish signal. Will the monthly bearish sign be invalidated? Will crude oil rally shortly?
Let’s start by taking a closer look at the long-term crude oil chart.
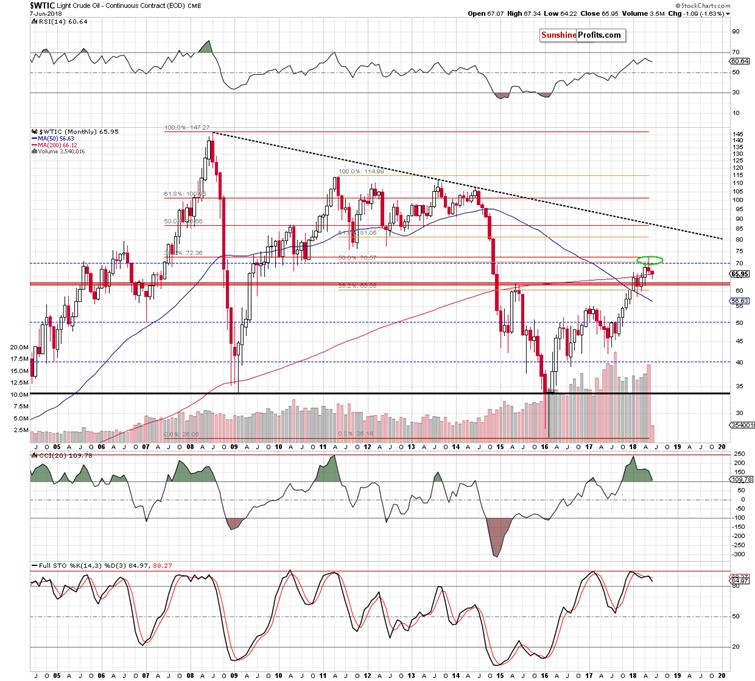
Crude oil’s May reversal is not a 100% classic book example as crude oil have erased some of the late-month declines, but it’s clear enough for the implications to be bearish. This is especially the case since the price of black gold reversed after reaching two important, long-term resistance levels: 50% Fibonacci retracement based on the 2011 – 2016 decline and (even more importantly) the 38.2% Fibonacci retracement based on the 2008 – 2016 decline.
Therefore, crude oil is likely to move lower not only in terms of days, but likely in terms of weeks, and perhaps even months.
The above implications are already playing out – despite this week’s comeback, crude oil is still over $1 below the May close and the odds are that it’s going to be much lower before June is over.
The CCI indicator in the lower part of the above chart shows why the implications could extend well beyond this month. Earlier this year, the indicator moved above 200 and now it’s moving lower and it’s about to break below the 100 level.
There were only two similar cases to the current one in the past decade. The first was in mid-2008 and the second one was in mid-2011. The former was followed by many tens of dollars of declines and the latter was followed by a decline of “only” over $35. The May top was formed at about $72, and it’s now at about $66, which means that it’s not even close to being as big as any of the previous declines that were similar with regard to CCI.
This means that crude oil is likely to fall further before the decline is over and the time factor adds credibility to this prediction. After all, both above-mentioned declines started in the middle of the year and that’s approximately where we are right now.
Having said that, let’s take a look at the weekly price changes.
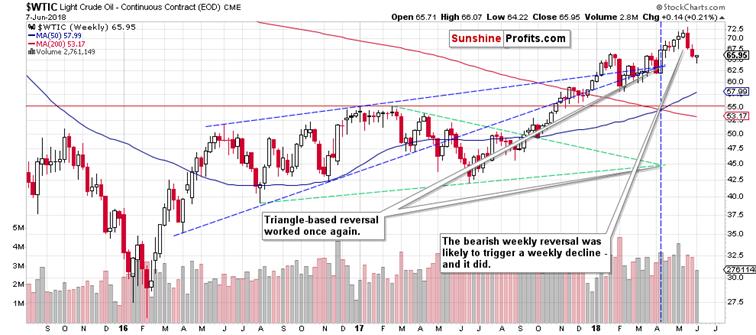
As we indicated earlier, crude oil has almost formed a bullish reversal candlestick. It’s clearly visible on the above chart, but the week is not over yet, so a lot could happen today. At the time of writing these words, crude oil is down by 33 cents, which means that if it closed at these prices, we would still have a weekly bullish reversal. The week would actually end in the red, but the reversal would have bullish implications anyway.
Will we see the above-mentioned bullish signal and will the black gold end up rallying on this bullish divergence? Let’s take a look at the daily price changes for details.
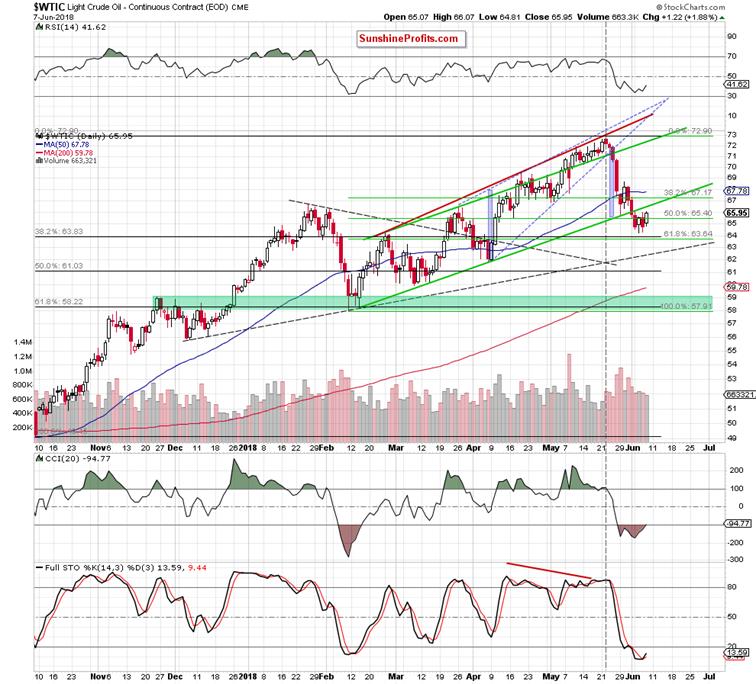
Unfortunately, the daily chart doesn’t provide us with any coherent explanations. The CCI and Stochastic provide us with bullish indications, especially the latter as its buy signal is clearer.
On the other hand, there are also bearish factors. Namely, crude oil may rally, but since it just broke below the rising green support/resistance line, it could now simply move to it and verify the breakdown. In this case, the upside would be limited to about $66.60 – just about a dollar above the current crude oil’s price.
Summing up, the overall immediate-term outlook is unclear and based on what happens today, we may or may not see additional strength next week before the big decline resumes. The latter seems likely to be in the cards based on long-term analogies and monthly reversal candlestick that we saw in May. The big move seems to be the thing that both: investors and traders should focus on, but it might be best to wait with entering trading positions once we see additional confirmations, similarly to what we did on May the 25th. The position that we had entered early on that day became profitable quickly and we were able to cash in the profits in just several days. This time, it may be better to wait longer for the trade to fully run its course, but the need to wait for confirmations remains the same.
If you enjoyed the above analysis and would like to receive free follow-ups, we encourage you to sign up for our daily newsletter – it’s free and if you don’t like it, you can unsubscribe with just 2 clicks. If you sign up today, you’ll also get 7 days of free access to our premium daily Oil Trading Alerts as well as Gold & Silver Trading Alerts. Sign up now.
Nadia Simmons
Forex & Oil Trading Strategist
Przemyslaw Radomski
Founder, Editor-in-chief
Sunshine Profits: Gold & Silver, Forex, Bitcoin, Crude Oil & Stocks
Stay updated: sign up for our free mailing list today
* * * * *
Disclaimer
All essays, research and information found above represent analyses and opinions of Nadia Simmons and Sunshine Profits' associates only. As such, it may prove wrong and be a subject to change without notice. Opinions and analyses were based on data available to authors of respective essays at the time of writing. Although the information provided above is based on careful research and sources that are believed to be accurate, Nadia Simmons and his associates do not guarantee the accuracy or thoroughness of the data or information reported. The opinions published above are neither an offer nor a recommendation to purchase or sell any securities. Nadia Simmons is not a Registered Securities Advisor. By reading Nadia Simmons’ reports you fully agree that he will not be held responsible or liable for any decisions you make regarding any information provided in these reports. Investing, trading and speculation in any financial markets may involve high risk of loss. Nadia Simmons, Sunshine Profits' employees and affiliates as well as members of their families may have a short or long position in any securities, including those mentioned in any of the reports or essays, and may make additional purchases and/or sales of those securities without notice.
© 2005-2022 http://www.MarketOracle.co.uk - The Market Oracle is a FREE Daily Financial Markets Analysis & Forecasting online publication.