


Crude Oil: It’s Here!
Commodities / Crude Oil May 25, 2018 - 03:02 PM GMTBy: Nadia_Simmons

 In the previous alerts we let you know how the situation in the crude oil was becoming increasingly bearish, but that it was not yet bearish enough to justify any action regarding the price. The risk was still too high to do so, and we explained that waiting for the confirmation was the preferable course of action. The confirmation has arrived.
Let's take a closer look at the charts below (charts courtesy of http://stockcharts.com).
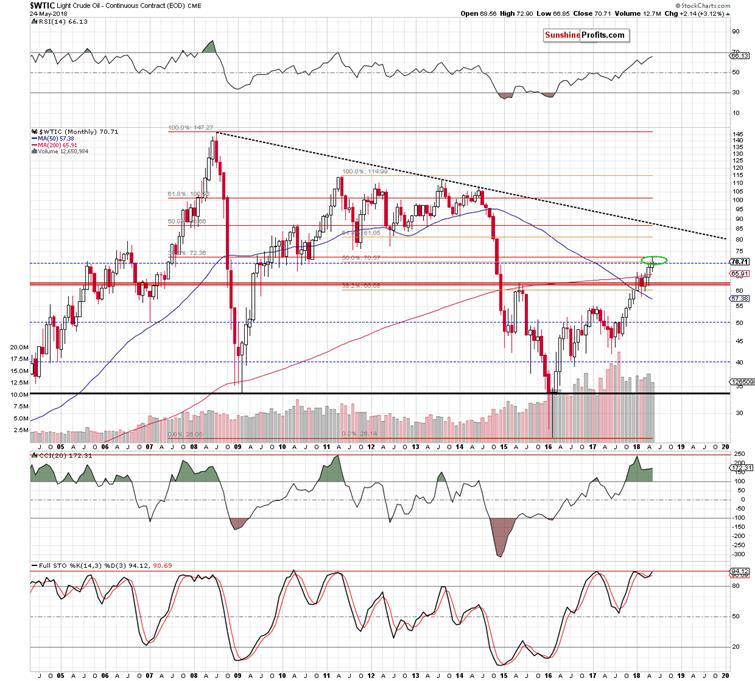
On the above chart we see that the price of crude oil has recently reached an important, long-term resistance area that we had marked with the green area in the previous analyses. It’s based on two important resistance levels. The first is the 50% Fibonacci retracement based on the 2011-2016 downward move and the second one is the 38.2% Fibonacci retracement based on the entire 2008-2016 decline.
Since the above-mentioned resistance levels were breached temporarily and both breakouts were invalidated (crude oil is below the 50% retracement at the moment of writing these words), the implications for the following weeks appear bearish. The confirmations that we meant previously, come mostly from the short-term charts though.
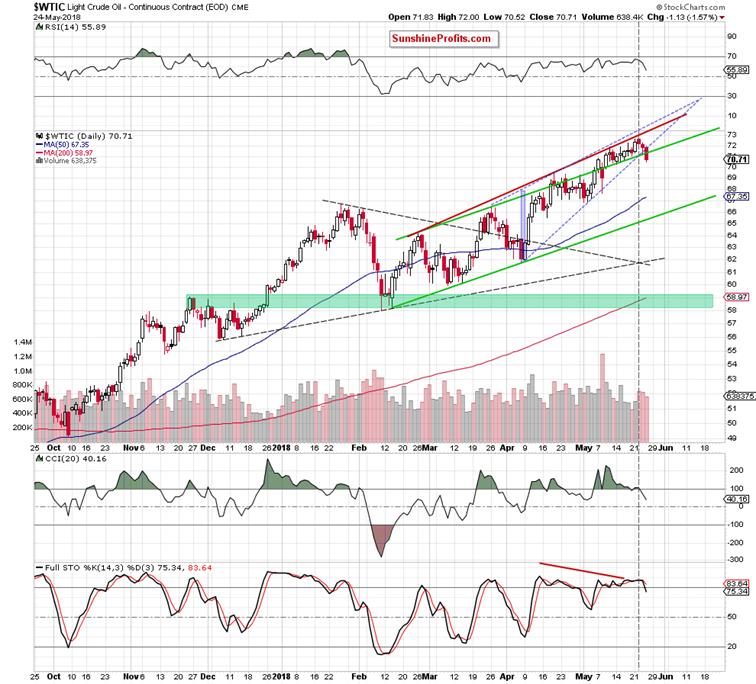
Crude oil was trading within the blue rising wedge and the red rising resistance line based on the previous highs and we previously wrote that without a major breakout above or below it, the outlook would not change significantly.
The confirmation and key sign that we saw yesterday was the above-mentioned breakdown. The important thing is that crude oil has not only broken below the rising wedge, but it has also broken below the upper border of the rising trend channel.
The move – and two previous daily declines – took place on volume that was higher than what we had seen in the previous days, which supports the bearish case.
The additional bearish signs come from the CCI and Stochastic indicators (both of which flashed sell signals) and the final – perhaps most important – confirmation comes from the triangle-apex-based reversal (we marked the triangle and the reversal date with grey dashed lines) that pointed to the final top of the decline. Knowing that we had seen one makes the current downswing much more believable.
Also, in our yesterday’s analysis, we pointed out that we had seen a decline in crude oil for two days in a row for the first time in almost 2 months. Now we have three days of subsequent declines. Something is definitely different about the market and since it was previously rallying without a bigger decline, it seems even more likely that we have one right now.
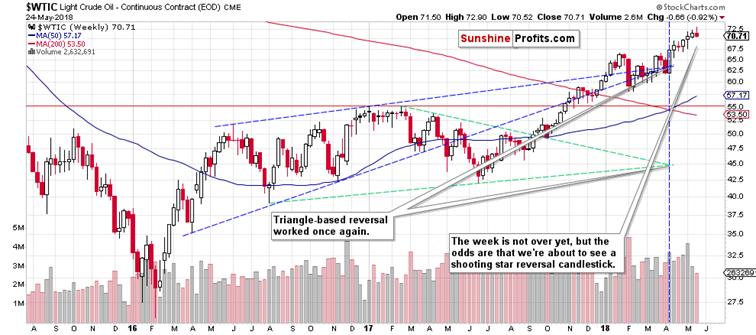
Finally, looking at the weekly candlesticks also points to a possible (!) bearish signal. We would like to emphasize that we are aware that no pattern is really useful before it is completed and while this is definitely the case with price formations like head and shoulders, as far as weekly candlesticks are concerned, we might already have some insight. The reason is that while a breakout or breakdown below a certain formation is critical as it demonstrates the strength of the market and without it, there are virtually no implications, the same doesn’t apply to candlesticks – at least not in the same way.
At this time 80% of this week’s trading is over and we know that crude oil moved $0.45 lower in today’s overnight trading. We also know that the volume is almost as high as last week even though we have volume data from only 4 trading days. This gives us good probability that the price of black gold will not end the week above $71.4 and if it closes below it, we will have a quite clear bearish reversal weekly candlestick that will likely be confirmed by significant volume. So, while the weekly reversal was not yet complete, we have a good chance of it being complete, so the implications are already somewhat bearish. Naturally, a somewhat bearish sign is not enough to justify changing the outlook on its own, but in this case it’s only something that confirms other - much clearer - signs.
Again, it doesn’t work in the same way with formations as whether the breakout is in or not is critical, and before it is seen, the formation could have entirely different implications than after it.
Summing up, based on the long-term resistance levels, short-term breakdowns and additional confirmations from other signals, the outlook for the price of crude oil is now bearish.
If you enjoyed the above analysis and would like to receive free follow-ups, we encourage you to sign up for our daily newsletter – it’s free and if you don’t like it, you can unsubscribe with just 2 clicks. If you sign up today, you’ll also get 7 days of free access to our premium daily Oil Trading Alerts as well as Gold & Silver Trading Alerts. Sign up now.
Nadia Simmons
Forex & Oil Trading Strategist
Przemyslaw Radomski
Founder, Editor-in-chief
Sunshine Profits: Gold & Silver, Forex, Bitcoin, Crude Oil & Stocks
Stay updated: sign up for our free mailing list today
* * * * *
Disclaimer
All essays, research and information found above represent analyses and opinions of Nadia Simmons and Sunshine Profits' associates only. As such, it may prove wrong and be a subject to change without notice. Opinions and analyses were based on data available to authors of respective essays at the time of writing. Although the information provided above is based on careful research and sources that are believed to be accurate, Nadia Simmons and his associates do not guarantee the accuracy or thoroughness of the data or information reported. The opinions published above are neither an offer nor a recommendation to purchase or sell any securities. Nadia Simmons is not a Registered Securities Advisor. By reading Nadia Simmons’ reports you fully agree that he will not be held responsible or liable for any decisions you make regarding any information provided in these reports. Investing, trading and speculation in any financial markets may involve high risk of loss. Nadia Simmons, Sunshine Profits' employees and affiliates as well as members of their families may have a short or long position in any securities, including those mentioned in any of the reports or essays, and may make additional purchases and/or sales of those securities without notice.
© 2005-2022 http://www.MarketOracle.co.uk - The Market Oracle is a FREE Daily Financial Markets Analysis & Forecasting online publication.