


Stock Market "Oops, They Did It Again"
Stock-Markets / Stock Markets 2018 Apr 24, 2018 - 08:04 AM GMTBy: EWI

See "a classic capitulation to a rising trend"
History often repeats. So, one way to make an educated guess about the future is to look at the past.
With that in mind, let me share with you a valuable observation from our market analysts: Overseas investors tend to jump into U.S. stocks near tops, and sell heavily near bottoms. In other words, their market actions usually are a contrarian indicator.
In a moment, I'll show you why this knowledge is relevant today. But first, let's see how this information has served our subscribers in the past.
Our first stop is this chart from the September 2000 Elliott Wave Financial Forecast.
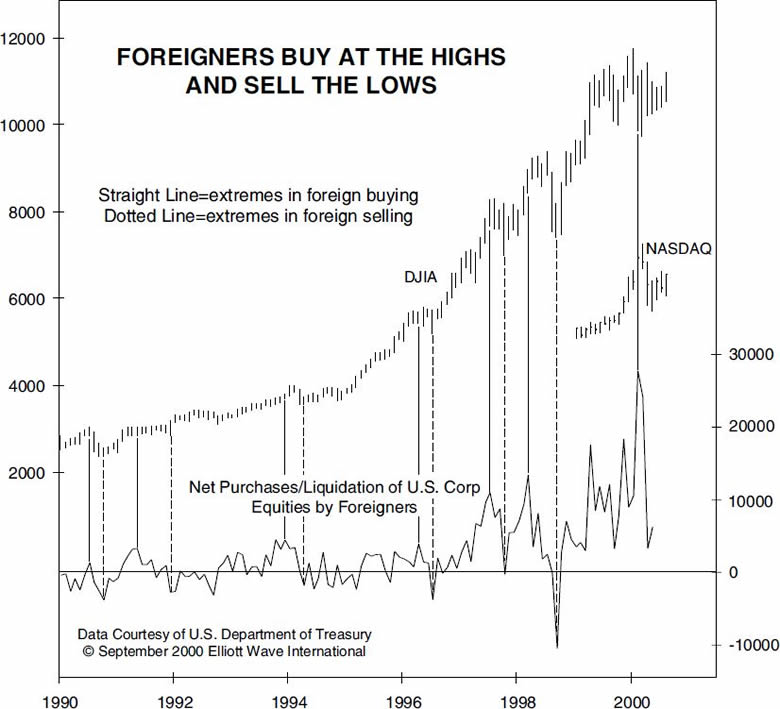
The publication noted:
Foreigners make their biggest commitments when major trends are about to reverse... This chart of the Dow and foreigners' net purchases of U.S. equities illustrates how beautifully the pattern has held through the U.S. bull market of the 1990s. The solid lines show the flood of foreign buyers within a month of each high, and the dotted lines show them rushing back out again on the months of the big lows.
The DJIA lost 50% of its value in the 2000-2002 bear market.
This next chart is from the August 2007 Financial Forecast, which said:
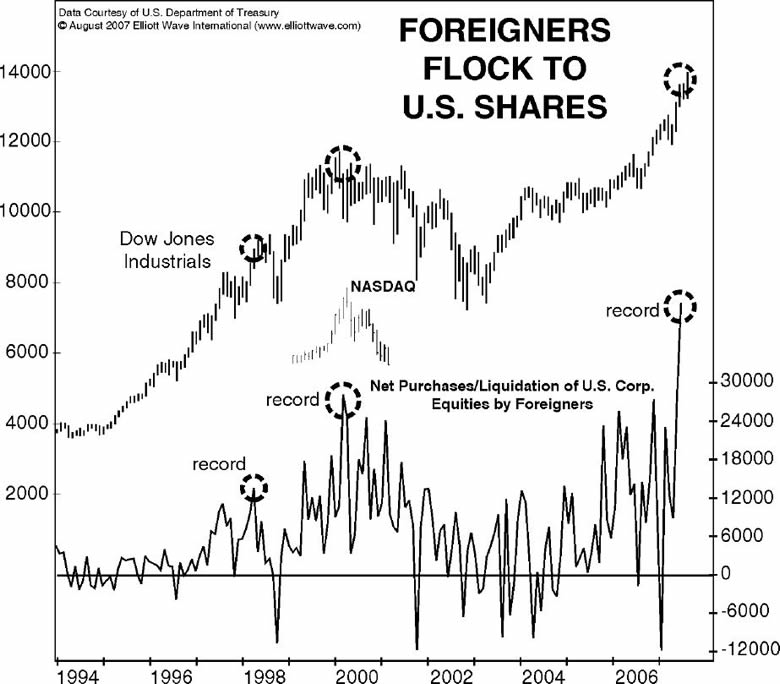
The first five months of [2007] produced what was easily the biggest gusher of net foreign buying in history. The record suggests that falling prices lie directly ahead for the U.S. market.
The DJIA went on to top just two months later, and entered the worst bear market since the Great Depression.
This chart from the April 2018 Financial Forecast recaps our commentary in 2000 and 2007 and then talks about today:
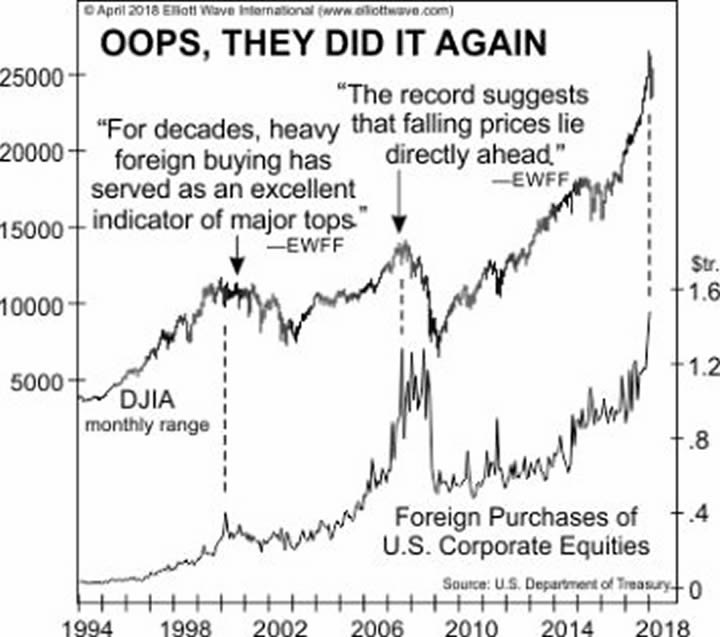
A new record high of nearly $1.5 trillion in net U.S. equity holdings by foreigners came as stocks topped in January. In a classic capitulation to a rising trend, foreigners' new record level of commitment didn't occur until December, when their amount of total stock buying finally exceeded the prior peak of August 2007. January's data, provided by the U.S. Treasury, are the latest available.
The April 2018 Financial Forecast is chock-full of charts, forecasts and insights you won't find anywhere else. See more via this sneak peek excerpt, which discusses the relationship between news and the U.S. stock indexes -- and what it means for investors.
This article was syndicated by Elliott Wave International and was originally published under the headline "Oops, They Did It Again". EWI is the world's largest market forecasting firm. Its staff of full-time analysts led by Chartered Market Technician Robert Prechter provides 24-hour-a-day market analysis to institutional and private investors around the world.
© 2005-2022 http://www.MarketOracle.co.uk - The Market Oracle is a FREE Daily Financial Markets Analysis & Forecasting online publication.