


Stock Market High Volatility is Not Consistently Bearish for Stocks
Stock-Markets / Stock Markets 2018 Apr 12, 2018 - 12:12 PM GMTBy: Troy_Bombardia

 The stock market started off in 2018 with a lot of volatility. The S&P 500 saw 23 trading days of >1% movements in Q1 (CLOSE vs previous day’s CLOSE).
This is supposed to be a long term bearish sign for the market. See this popular tweet:
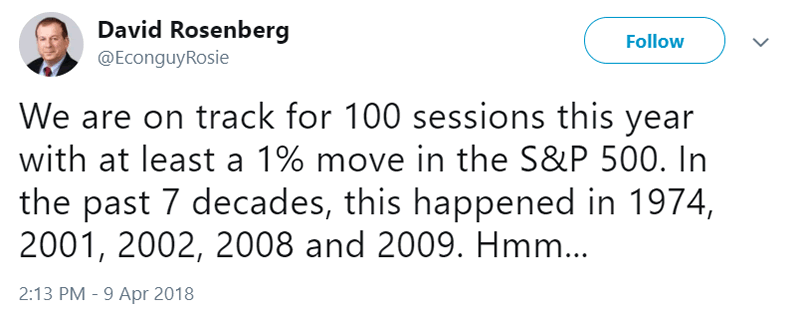
This tweet is wrong on 2 levels:
- There hasn’t even been 100 trading sessions in 2018 yet. The market won’t be this volatile throughout the rest of 2018. Expecting volatility to continue and then “predicting” a parallel to bear market cases does not “prove” anything. It’s just extrapolating and making up your own conclusions.
- High volatility is not a consistently long term bearish sign for stocks. High volatility is irrelevant to the long term.
We’re going to look at what happens next to the stock market when Q1 is very volatile (January-March)? Does this mean that the stock market will go down during the rest of the year? Let’s look at the historical cases in which the S&P saw at least 20 trading days of >1% movements in Q1.
Here are those historical years since 1990:
- 2018 (current case)
- 2016
- 2009
- 2008
- 2003
- 2001
- 2000
- 1999
- 1991
As you can see, the stock market’s volatility is very high right now, but there is nothing abnormal about this. There’s no point in even showing all the years since 1950 in which the year starts with high volatility. High volatility is neither consistently bullish nor consistently bearish for the stock market.
- Sometimes the stock market goes up throughout the rest of the year when the year starts off with high volatility.
- Sometimes the stock market goes down throughout the rest of the year when the year starts off with high volatility.
High volatility is a medium term bullish sign for the stock market. It’s irrelevant for the stock market’s long term outlook.
Let’s look at these historical cases:
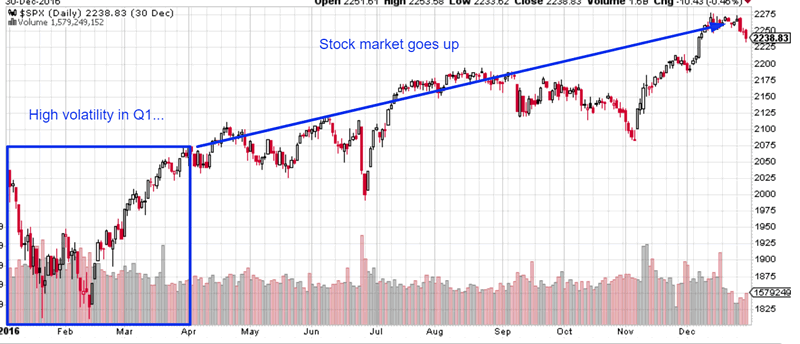
2016
The stock market was very volatile in Q1 2016. It still went up the rest of the year.
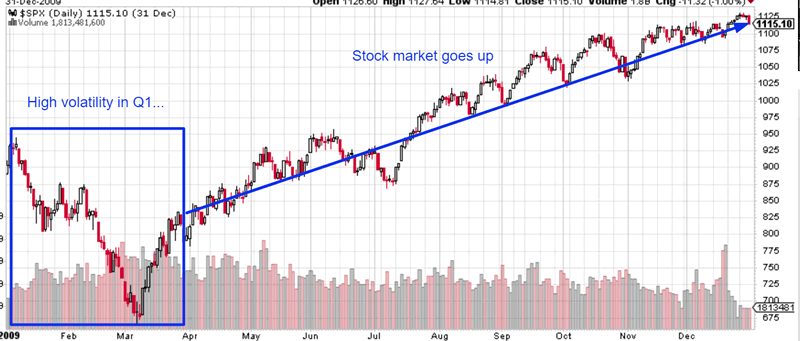
2009
The stock market was very volatile in Q1 2009, and this volatility was to the downside. It still went up the rest of the year.
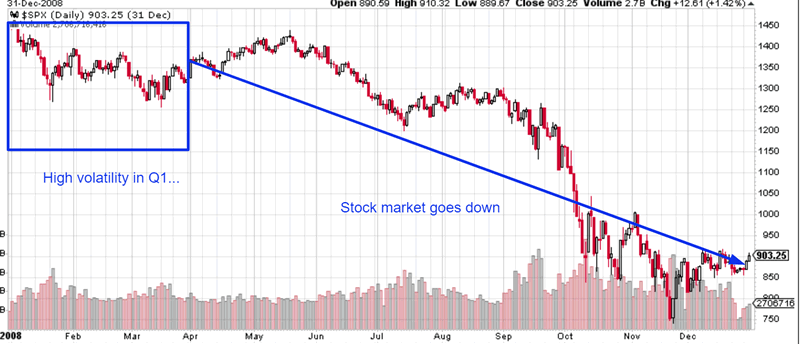
2008
The stock market was very volatile in Q1 2008. The stock market crashed in 2008.
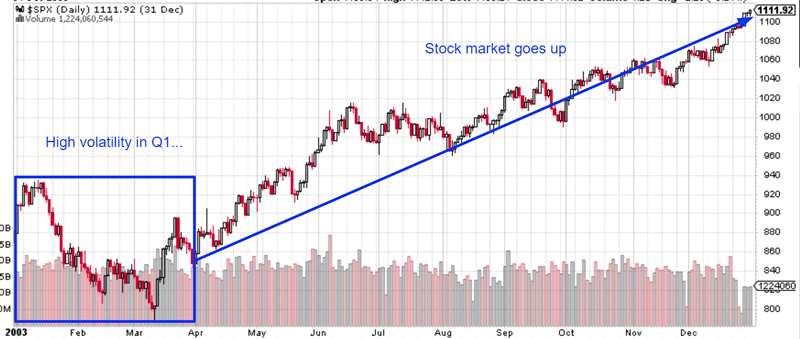
2003
The stock market was very volatile in Q1 2003, and this volatility was mostly to the downside. It still went up the rest of the year.
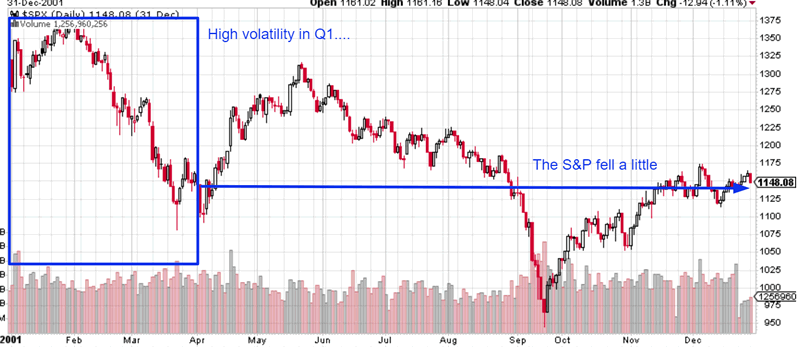
2001
The stock market was very volatile in Q1 2001. The stock market was mostly flat the rest of the year, although it did make “lower highs and lower lows”.
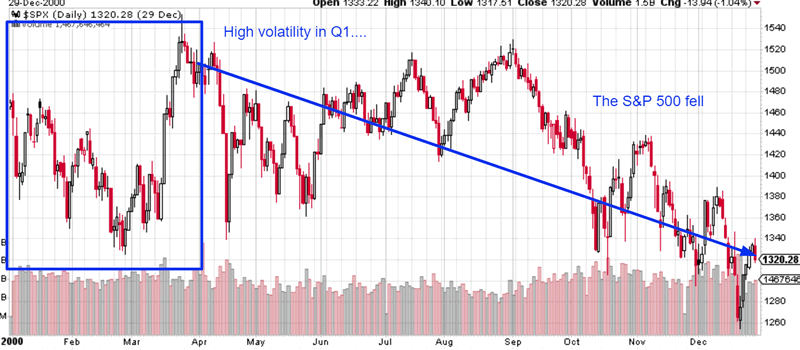
2000
The stock market was very volatile in Q1 2000. It went down the rest of the year.
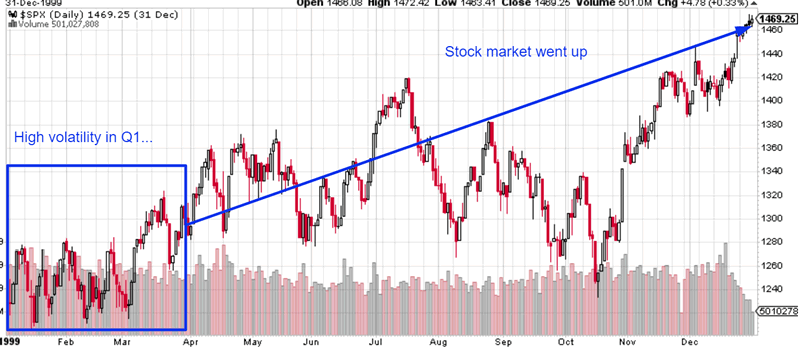
1999
The stock market was very volatile in Q1 1999. It still went up the rest of the year.
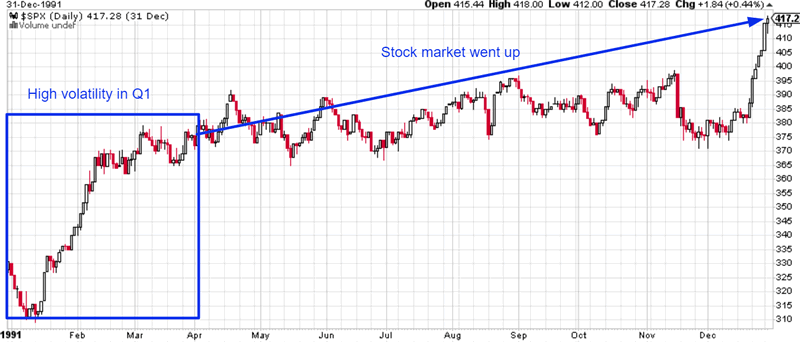
1991
The stock market was very volatile in Q1 1991. It still went up the rest of the year. This historical case does not apply to today because its volatility was all towards the upside, whereas the stock market’s volatility is mostly to the downside.
Conclusion
There is nothing meaningful about a year that starts off with high volatility. This does not “hint at” a mega-crash or bear market. This is an irrelevant factor for the long term.
By Troy Bombardia
I’m Troy Bombardia, the author behind BullMarkets.co. I used to run a hedge fund, but closed it due to a major health scare. I am now enjoying life and simply investing/trading my own account. I focus on long term performance and ignore short term performance.
Copyright 2018 © Troy Bombardia - All Rights Reserved
Disclaimer: The above is a matter of opinion provided for general information purposes only and is not intended as investment advice. Information and analysis above are derived from sources and utilising methods believed to be reliable, but we cannot accept responsibility for any losses you may incur as a result of this analysis. Individuals should consult with their personal financial advisors.
Troy Bombardia Archive |
© 2005-2022 http://www.MarketOracle.co.uk - The Market Oracle is a FREE Daily Financial Markets Analysis & Forecasting online publication.