


Stock Market Update: S&P 495 Versus The Big 5 FANG Stocks
Stock-Markets / Stock Markets 2018 Apr 06, 2018 - 09:04 AM GMTBy: WMA

 We have been marveling at the outperformance of the biggest five companies in the S&P 500 (Apple, Microsoft, Amazon, Google, and Facebook) for some time (see our May 5, 2017 Commentary, “The S&P 500 or The S&P 495?”). Technology has almost single-handedly driven the equity market into an extraordinary bubble. Tech had been red hot since the January 2016 equity market correction. Tech was hot, but now it is not.
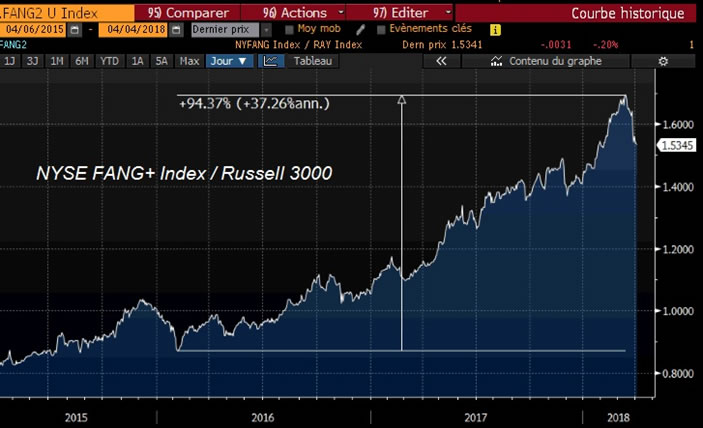
Enthusiasm for the mega cap tech stocks even provoked the creation of a new index, the NYSE FANG+ Index. The equally-weighted index includes ten companies which the market has fallen in love with: Apple, Netflix, Google, NVIDIA, Amazon, Tesla, Baidu, Alibaba, Facebook, and Twitter. The chart below shows the FANG index relative to the Russell 3000. These ten stocks almost DOUBLED the broad market performance in two years time.
In addition, a futures product on this FANG index (June contract ticker: FNSM8) was created last December. Creating a futures contract on a hot financial asset (see the performance of Bitcoin – down -63% – since the first futures contract was listed on the CME last December 15) is certainly a sign of euphoria and most likely the proximity of a market top.
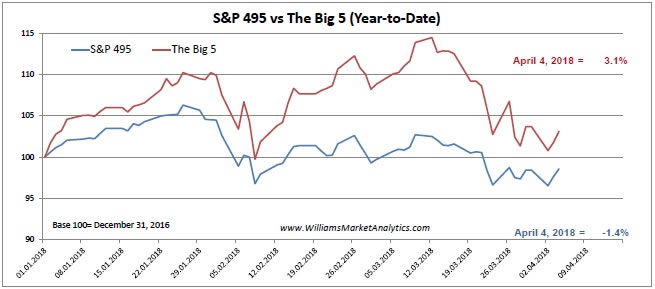
Tops are a process and bottoms are an event. We believe that the Big 5 are now in a topping formation. Looking at the year-to-date performance of the Big 5 versus the S&P 495, the outperformance of the former, while still present, is definitely slowing. Since the Nasdaq-100 and the Big 5 peaked on March 12 (for market historians, the Tech Bubble also peaked in March of 2000), the Big 5 are down -9.91% (through Wednesday’s close) while the S&P 495 are only down 3.82% (see first chart below). While this could be a blip in a continuing trend of mega tech outperformance, we see the first signs of a major change in sector leadership.
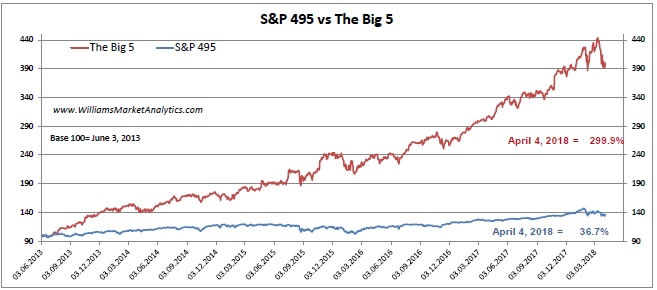
We have a litany of reasons why we would be more comfortable holding short positions in the Big 5 rather than maintaining buy/hold positions. Below is the chart of the Big 5 outperformance since 2013. This is not a late April fool’s joke. We cannot explain how every type of investor, algo trading program, and central bank were able to all pile into the same five stocks and make significant excess returns to this degree and for this length of time. The laws of financial markets dictate that no asset can outperform forever. However, investors still find the tech story compelling. We all see how smart phones, social media, autonomous driving, and other technical wonders are changing the world. Nevertheless, investors should not buy companies for known narratives but rather for future earnings potential.
To this point, are tech earnings justifying the price run-up in these tech stocks? Not at all, it would appear. We looked at trailing 12-month (realized) earnings, instead of optimistic (speculative) forward earnings and compared real earnings with the price of each of the Big 5 since 2013.
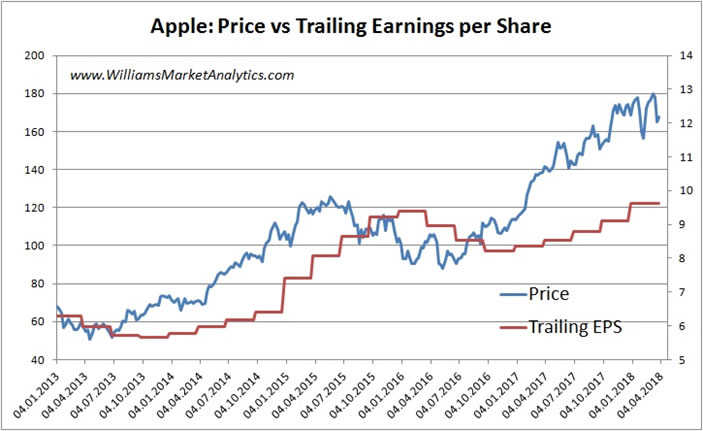
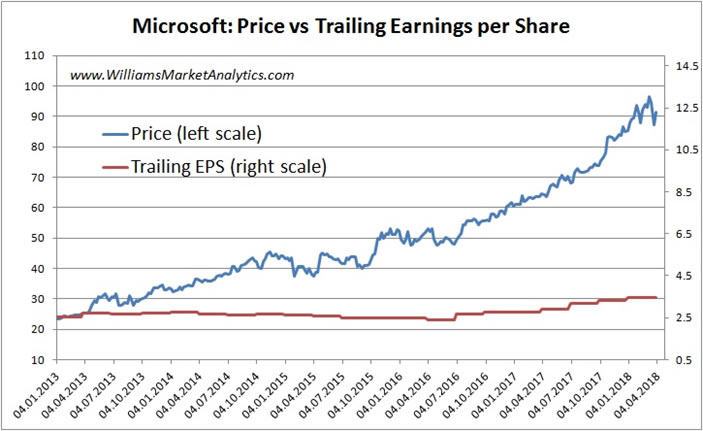
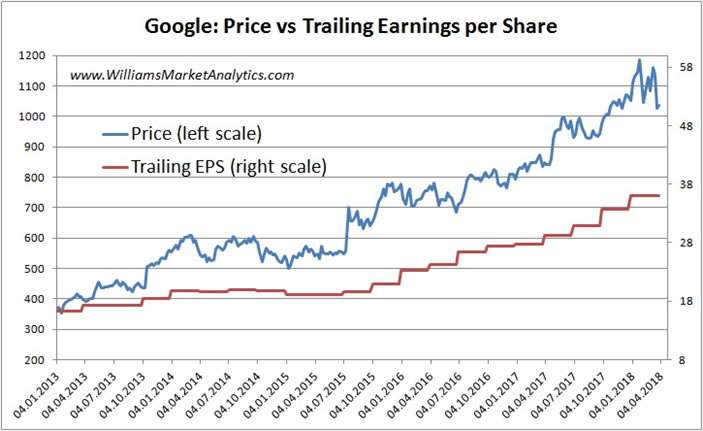
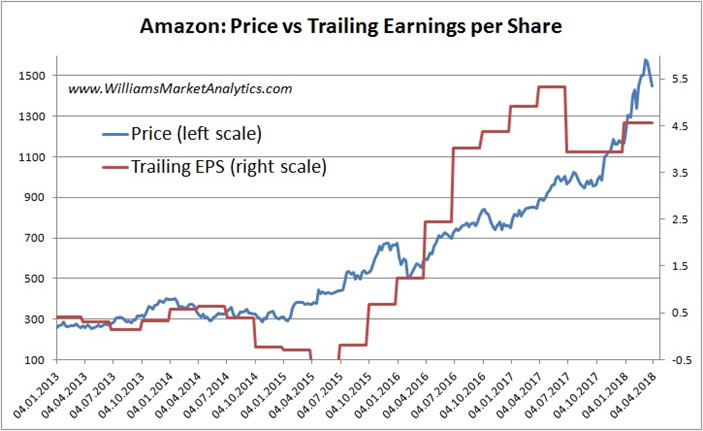
With the possible exception of Amazon, whose earnings more or less followed price until 2017, we can see that price momentum has generally outstripped earnings momentum.
Another way to consider whether current prices are justified is to compare price to the firm’s earnings growth rate (the PEG ratio, or price-to-earnings-growth). The table below looks at the evolution of the Big 5 PEG ratios since 2013.
Company |
PEG in 2013 |
PEG today |
increase/decrease |
Apple |
0.45 |
1.23 |
+173% |
Microsoft |
0.78 |
2.27 |
+191% |
Amazon |
2.10 |
2.85 |
+36% |
0.79 |
1.01 |
+28% |
|
1.45 |
0.75 |
-48% |
Based on the PEG ratio, Apple and Amazon are absurd. Investors have been paying many times more for shares of these companies stocks relative to the firm’s earnings growth rates. Amazon and Google are also bid up beyond growth rates (speculation). Only Facebook’s earnings growth has outstripped the appreciation of share prices (although as we saw above, EPS has significantly lagged price gains).
Squeezing Out Every Last Percent
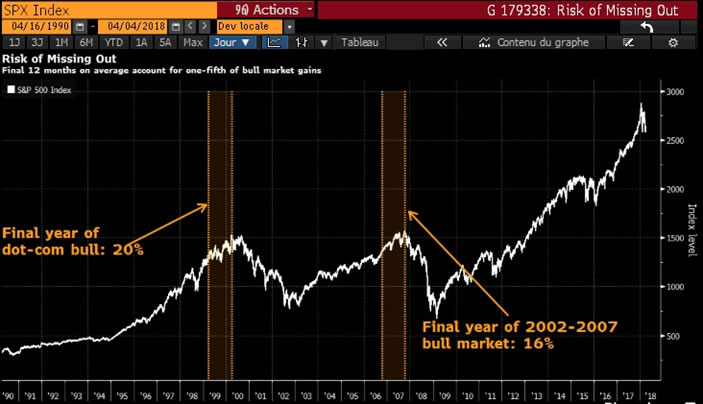
While we have shown that equity markets have gone well beyond levels that normally mark a top (excessive margin debt, valuations, duration of bull market, etc), buyers are still present. An interesting chart (below), shows that one-fifth of bull market gains occur in the last 12-months of the bull market. Getting out early therefore can be very costly for a fund manager. The large proportion of gains at the end of a bull makes sense in the context of Modern Portfolio Theory. Higher gains accrue to investments that undertake greater risk (this is why a T-Bill earns little return). So while the risk of being left holding the bag, so to speak, as equity markets swing into a bear market is great, in the meantime investors enjoy strong gains.
So while it would seem irrational to stay fully invested in the 9th year of a bull market with valuations at record highs, some professional investors don’t have a choice. They must chase every last percent gain in the bull market to avoid underperforming during a period. Be aware that as equity indexes start showing lower highs and lower lows, the initial rush out by these “late players” will be brutal. Playing a late-stage bull market is not for cautious investors!
By Williams Market Analytics
http://www.williamsmarketanalytics.com
We provide insightful market analysis and account management founded upon our very successful systematic, disciplined approach to investing. Our investment analysis revolves around two inputs: company valuation and our quantitative, market-based indicators. Learn more about our approach and our strategist.
© 2018 Copyright Williams Market Analytics - All Rights Reserved
Disclaimer: The above is a matter of opinion provided for general information purposes only and is not intended as investment advice. Information and analysis above are derived from sources and utilising methods believed to be reliable, but we cannot accept responsibility for any losses you may incur as a result of this analysis. Individuals should consult with their personal financial advisors.
© 2005-2022 http://www.MarketOracle.co.uk - The Market Oracle is a FREE Daily Financial Markets Analysis & Forecasting online publication.